
Compare Interactive Fin with Similar Stocks
Total Returns (Price + Dividend) 
Interactive Fin for the last several years.
Risk Adjusted Returns v/s
Returns Beta

News
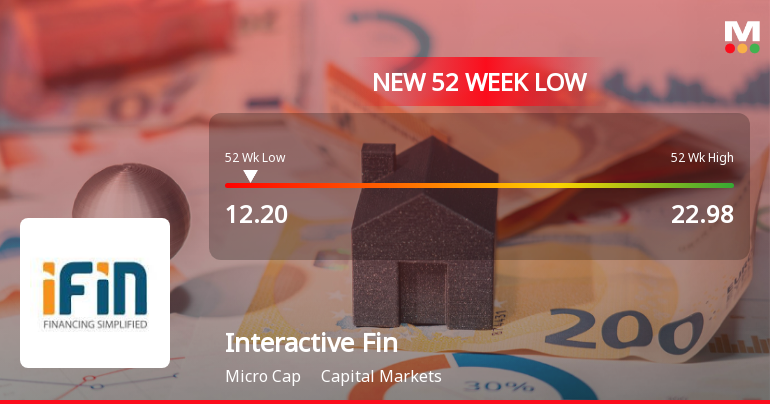
Interactive Financial Services Ltd Falls to 52-Week Low of Rs 12.2 as Sell-Off Deepens
For the second consecutive session, Interactive Financial Services Ltd has seen its share price decline, hitting a fresh 52-week low of Rs 12.2 on 9 Jul 2026. This drop comes amid a broader market rally, underscoring a stark divergence between the stock's performance and the overall capital markets sector.
Read full news article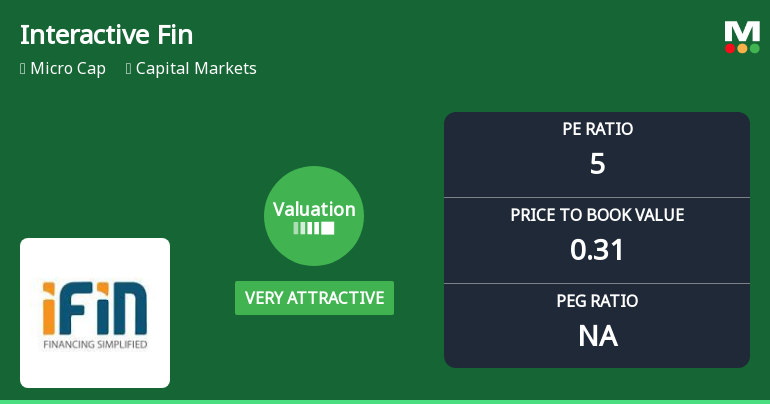
Interactive Financial Services Ltd: Valuation Shifts Signal Renewed Price Attractiveness
Interactive Financial Services Ltd has witnessed a significant shift in its valuation parameters, moving from an attractive to a very attractive rating, despite ongoing challenges reflected in its market performance and financial metrics. This article analyses the recent changes in price-to-earnings (P/E) and price-to-book value (P/BV) ratios, compares them with peer averages and historical benchmarks, and assesses the implications for investors navigating the capital markets sector.
Read full news articleAre Interactive Financial Services Ltd latest results good or bad?
Interactive Financial Services Ltd has reported significant operational developments in its latest financial results for Q4 FY26. The company achieved a net profit of ₹1.33 crores, marking a substantial turnaround from a loss in the same quarter last year. This reflects a notable recovery in profitability, driven by a strong revenue growth of 234.12% year-on-year, with net sales reaching ₹2.84 crores. The sequential performance also shows momentum, with revenues increasing by 83.23% from the previous quarter. The operating margin, excluding other income, stood at an impressive 75.35%, a dramatic shift from a negative margin recorded a year earlier. This suggests effective cost management and possibly favorable project economics. Additionally, the company's return on equity averaged 12.93%, indicating moderate capital efficiency. Despite these positive operational metrics, the company faces challenges. The...
Read full news article Announcements
Closure of Trading Window
27-Jun-2026 | Source : BSEIntimation of Closure of Trading Window.
Announcement under Regulation 30 (LODR)-Newspaper Publication
30-May-2026 | Source : BSENewspaper Advertisement
Statement Of Deviation Or Variation In The Use Of Proceeds Of Right Issue Of Equity Shares
29-May-2026 | Source : BSEStatement of Deviation
Corporate Actions

No Upcoming Board Meetings

No Dividend history available

No Splits history available

No Bonus history available

Interactive Financial Services Ltd has announced 13:10 rights issue, ex-date: 17 Jan 25
Quality key factors
Valuation key factors
Technicals key factors
 Technical Indicator Scale: Bearish, Mildly Bearish, Sideways, Mildly Bullish, Bullish Turned
 Shareholding Snapshot : Mar 2026
Shareholding Compare (%holding)
Non Institution
None
Held by 0 Schemes
Held by 0 FIIs
None
Pradip Ramprasad Sandhir (14.01%)
55.84%
Quarterly Results Snapshot (Standalone) - Mar'26 - YoY

YoY Growth in quarter ended Mar 2026 is 234.12% vs 16.44% in Mar 2025
YoY Growth in quarter ended Mar 2026 is 441.03% vs -5.41% in Mar 2025
Half Yearly Results Snapshot (Standalone) - Sep'25

Growth in half year ended Sep 2025 is -43.45% vs 213.69% in Sep 2024
Growth in half year ended Sep 2025 is -40.83% vs 270.51% in Sep 2024
Nine Monthly Results Snapshot (Standalone) - Dec'25
YoY Growth in nine months ended Dec 2025 is -30.95% vs 180.34% in Dec 2024
YoY Growth in nine months ended Dec 2025 is -33.33% vs 230.61% in Dec 2024
Annual Results Snapshot (Standalone) - Mar'26
YoY Growth in year ended Mar 2026 is -0.54% vs 141.37% in Mar 2025
YoY Growth in year ended Mar 2026 is 22.46% vs 367.21% in Mar 2025
About Interactive Financial Services Ltd

Company Coordinates


