
Compare CG Power & Ind with Similar Stocks
Dashboard
Strong Long Term Fundamental Strength with an average Return on Equity (ROE) of 32.05%
- Healthy long term growth as Net Sales has grown by an annual rate of 33.18% and Operating profit at 133.13%
- The company is Net-Debt Free
Positive results in Mar 26
High Institutional Holdings at 30.11%
Company is among the highest 1% of companies rated by MarketsMojo across all 4,000 stocks
Market Beating performance in long term as well as near term
Stock DNA
Heavy Electrical Equipment
INR 144,079 Cr (Large Cap)
117.00
44
0.14%
-0.16
15.45%
17.99
Total Returns (Price + Dividend) 
Latest dividend: 1.3 per share ex-dividend date: Jan-30-2026
Risk Adjusted Returns v/s
Returns Beta

News

CG Power & Industrial Solutions Ltd is Rated Buy
CG Power & Industrial Solutions Ltd is rated 'Buy' by MarketsMOJO, with this rating last updated on 05 May 2026. However, the analysis and financial metrics discussed here reflect the stock's current position as of 11 July 2026, providing investors with an up-to-date view of the company’s fundamentals, returns, and market performance.
Read full news article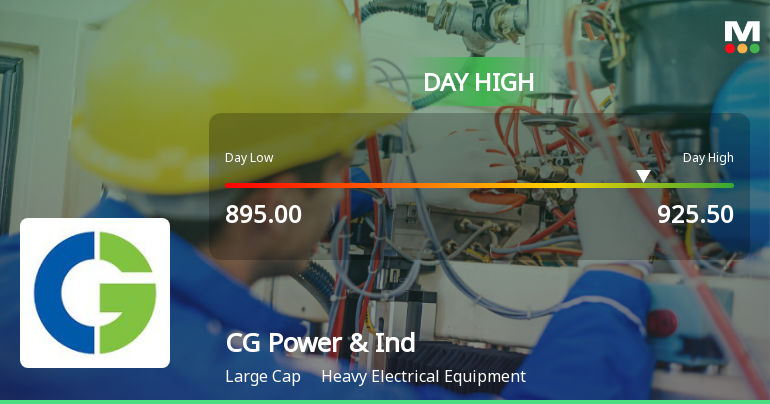
CG Power & Industrial Solutions Ltd Surges 3.14% to Day's High of Rs 924.6 — Outperforms Sector by 1.95 Percentage Points
The Sensex advanced 0.4% on 6 Jul 2026, yet CG Power & Industrial Solutions Ltd outpaced the broader market with a 3.14% gain, reaching an intraday high of Rs 924.6. This 1.95 percentage-point outperformance over its sector signals a stock-specific strength rather than a general market uplift.
Read full news article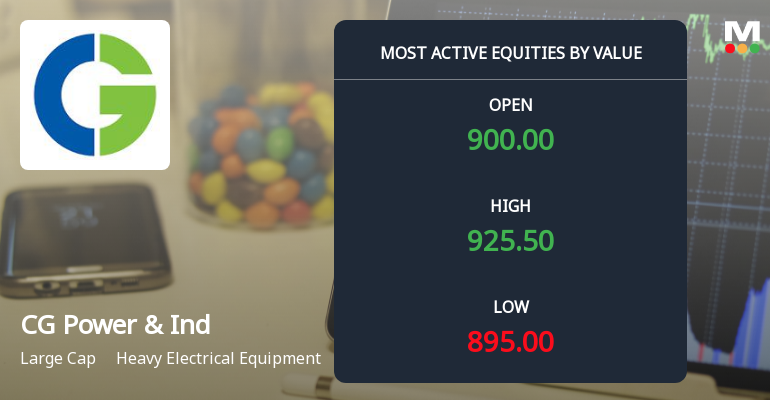
CG Power & Industrial Solutions Ltd Sees Robust Trading Activity and Upgraded Mojo Grade
CG Power & Industrial Solutions Ltd (CGPOWER) emerged as one of the most actively traded stocks by value on 6 July 2026, registering a significant uptick in investor interest and institutional participation. The large-cap heavy electrical equipment company outperformed its sector and broader market indices, reflecting renewed confidence among market participants.
Read full news article Announcements
Announcement under Regulation 30 (LODR)-Press Release / Media Release
04-Jul-2026 | Source : BSEPlease find enclosed Press Release dated 4th July 2026 issued by CG Semi Private Limited a subsidiary of the Company.
Announcement under Regulation 30 (LODR)-Newspaper Publication
01-Jul-2026 | Source : BSEPlease find enclosed the disclosure alongwith the copy of the newspaper publication regarding the 89th Notice of Annual General Meeting scheduled to be held on 24th July 2026 is published.
89Th Annual General Meeting Of The Company Scheduled To Be Held On 24Th July 2026.
30-Jun-2026 | Source : BSEPlease find enclosed the Annual Report along with the Notice of the Annual General Meeting scheduled to be held on 24th July 2026.
Corporate Actions

No Upcoming Board Meetings

CG Power & Industrial Solutions Ltd has declared 65% dividend, ex-date: 30 Jan 26

CG Power & Industrial Solutions Ltd has announced 2:10 stock split, ex-date: 10 Aug 06

CG Power & Industrial Solutions Ltd has announced 3:4 bonus issue, ex-date: 08 Mar 10

No Rights history available
Quality key factors
Valuation key factors
Technicals key factors
 Technical Indicator Scale: Bearish, Mildly Bearish, Sideways, Mildly Bullish, Bullish Turned
 Shareholding Snapshot : Mar 2026
Shareholding Compare (%holding)
Promoters
None
Held by 38 Schemes (9.45%)
Held by 613 FIIs (12.03%)
Tube Investments Of India Limited (56.29%)
Qualified Institutional Buyers (4.05%)
11.36%
Quarterly Results Snapshot (Consolidated) - Mar'26 - QoQ

QoQ Growth in quarter ended Mar 2026 is 8.39% vs 8.64% in Dec 2025

QoQ Growth in quarter ended Mar 2026 is 28.32% vs -0.66% in Dec 2025
Half Yearly Results Snapshot (Consolidated) - Sep'25
Growth in half year ended Sep 2025 is 25.01% vs 19.73% in Sep 2024
Growth in half year ended Sep 2025 is 20.31% vs 3.63% in Sep 2024
Nine Monthly Results Snapshot (Consolidated) - Dec'25
YoY Growth in nine months ended Dec 2025 is 25.44% vs 22.23% in Dec 2024
YoY Growth in nine months ended Dec 2025 is 19.66% vs -41.12% in Dec 2024
Annual Results Snapshot (Consolidated) - Mar'26
YoY Growth in year ended Mar 2026 is 25.32% vs 23.15% in Mar 2025
YoY Growth in year ended Mar 2026 is 23.77% vs -31.70% in Mar 2025
About CG Power & Industrial Solutions Ltd

Company Coordinates


