
Compare Wim Plast with Similar Stocks
Stock DNA
Diversified consumer products
INR 458 Cr (Micro Cap)
8.00
38
2.62%
-0.57
10.98%
0.83
Total Returns (Price + Dividend) 
Latest dividend: 10 per share ex-dividend date: Aug-01-2025
Risk Adjusted Returns v/s
Returns Beta

News

Wim Plast Ltd is Rated Sell
Wim Plast Ltd is rated 'Sell' by MarketsMOJO, with this rating last updated on 05 Dec 2025. However, the analysis and financial metrics discussed here reflect the stock's current position as of 06 May 2026, providing investors with an up-to-date view of the company’s fundamentals, returns, and market performance.
Read full news article
Wim Plast Ltd is Rated Sell
Wim Plast Ltd is rated 'Sell' by MarketsMOJO, with this rating last updated on 05 Dec 2025. However, the analysis and financial metrics discussed here reflect the stock's current position as of 25 April 2026, providing investors with an up-to-date perspective on the company’s performance and outlook.
Read full news article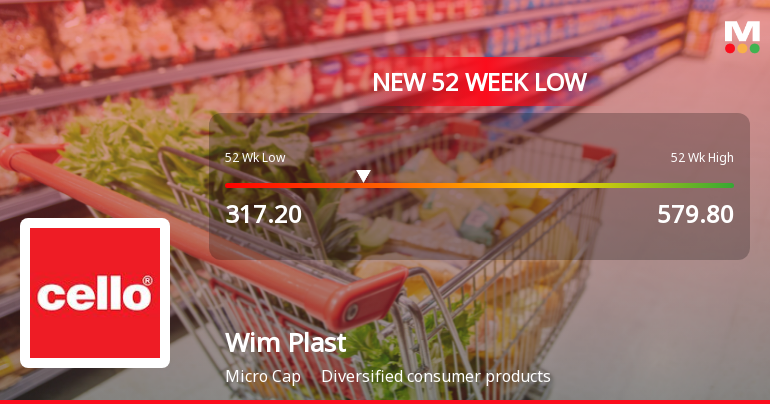
Announcements
Format of the Initial Disclosure to be made by an entity identified as a Large Corporate : Annexure A
27-Apr-2026 | Source : BSEFormat of Initial Disclosure to be made by an entity identified as a Large Corporate.
| Sr. No. | Particulars | Details |
| 1 | Name of Company | Wim Plast Ltd- |
| 2 | CIN NO. | L25209DD1988PLC001544 |
| 3 | Outstanding borrowing of company as on 31st March / 31st December as applicable (in Rs cr) | 0.00 |
| 4 | Highest Credit Rating during the previous FY | NA |
| 4a | Name of the Credit Rating Agency issuing the Credit Rating mentioned in (4) | Not Applicable |
| 5 | Name of Stock Exchange# in which the fine shall be paid in case of shortfall in the required borrowing under the framework | BSE |
Designation: Company Secretary and Compliance Officer
EmailId: darsha.adodra@celloworld.com
Designation: Chief Financial Officer
EmailId: madhusudan.jangid@celloworld.com
Date: 27/04/2026
Note: In terms para of 3.2(ii) of the circular beginning F.Y 2022 in the event of shortfall in the mandatory borrowing through debt securities a fine of 0.2% of the shortfall shall be levied by Stock Exchanges at the end of the two-year block period. Therefore an entity identified as LC shall provide in its initial disclosure for a financial year the name of Stock Exchange to which it would pay the fine in case of shortfall in the mandatory borrowing through debt markets.
Compliances-Certificate under Reg. 74 (5) of SEBI (DP) Regulations 2018
10-Apr-2026 | Source : BSEEnclosed h/w is the certificate confirming compliance under Regulation 74(5) of SEBI (Depositories and Participants) Regulations 2018 for the quarter ended 31st March 2026.
Closure of Trading Window
25-Mar-2026 | Source : BSEIntimation of Closure of Trading Window w.e.f. April 1 2026
Corporate Actions

No Upcoming Board Meetings

Wim Plast Ltd has declared 100% dividend, ex-date: 01 Aug 25

No Splits history available

Wim Plast Ltd has announced 1:1 bonus issue, ex-date: 08 Sep 16

No Rights history available
Quality key factors
Valuation key factors
Technicals key factors
 Technical Indicator Scale: Bearish, Mildly Bearish, Sideways, Mildly Bullish, Bullish Turned
 Shareholding Snapshot : Mar 2026
Shareholding Compare (%holding)
Promoters
None
Held by 1 Schemes (3.81%)
Held by 0 FIIs
Cello World Limited (54.92%)
Hsbc Small Cap Fund (3.81%)
35.06%
Quarterly Results Snapshot (Consolidated) - Dec'25 - YoY

YoY Growth in quarter ended Dec 2025 is -10.56% vs 6.85% in Dec 2024
YoY Growth in quarter ended Dec 2025 is -5.47% vs 5.21% in Dec 2024
Half Yearly Results Snapshot (Consolidated) - Sep'25
Growth in half year ended Sep 2025 is 3.36% vs 6.91% in Sep 2024

Growth in half year ended Sep 2025 is 13.77% vs -2.48% in Sep 2024
Nine Monthly Results Snapshot (Consolidated) - Dec'25
YoY Growth in nine months ended Dec 2025 is -1.59% vs 6.89% in Dec 2024
YoY Growth in nine months ended Dec 2025 is 7.17% vs 0.03% in Dec 2024
Annual Results Snapshot (Consolidated) - Mar'25
YoY Growth in year ended Mar 2025 is 7.16% vs 3.70% in Mar 2024
YoY Growth in year ended Mar 2025 is 2.51% vs 33.68% in Mar 2024
About Wim Plast Ltd

Company Coordinates


