
Compare Faze Three with Similar Stocks
Dashboard
Poor long term growth as Operating profit has grown by an annual rate 5.91% of over the last 5 years
With ROCE of 7.4, it has a Expensive valuation with a 2.3 Enterprise value to Capital Employed
Despite the size of the company, domestic mutual funds hold only 0% of the company
Stock DNA
Garments & Apparels
INR 1,322 Cr (Micro Cap)
40.00
23
0.00%
0.54
7.42%
2.94
Total Returns (Price + Dividend) 
Latest dividend: 0.5 per share ex-dividend date: Jun-06-2022
Risk Adjusted Returns v/s
Returns Beta

News

Faze Three Ltd Downgraded to Sell Amid Expensive Valuation and Slowing Growth
Faze Three Ltd, a micro-cap player in the Garments & Apparels sector, has seen its investment rating downgraded from Hold to Sell by MarketsMOJO as of 8 June 2026. The revision reflects a deteriorating valuation profile, subdued financial trends, and mixed technical signals despite recent positive quarterly results. This comprehensive analysis explores the four key parameters—Quality, Valuation, Financial Trend, and Technicals—that triggered the downgrade and what it means for investors.
Read full news article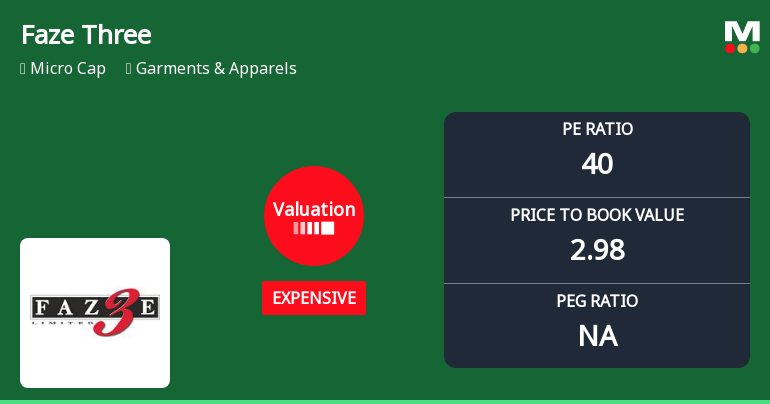
Faze Three Ltd Valuation Shifts Signal Changing Market Sentiment
Faze Three Ltd, a micro-cap player in the Garments & Apparels sector, has seen a notable shift in its valuation parameters, moving from fair to expensive territory. Despite this, the stock has delivered robust returns well above the Sensex benchmark over multiple time horizons, prompting a reassessment of its investment appeal with a recent upgrade to a Hold rating.
Read full news article
Faze Three Ltd Upgraded to Hold as Technicals Improve and Financials Stabilise
Faze Three Ltd, a micro-cap player in the Garments & Apparels sector, has seen its investment rating upgraded from Sell to Hold as of 29 May 2026. This change reflects a combination of improved technical indicators, a rebound in financial performance, and a more balanced valuation profile, signalling cautious optimism among investors after a period of underperformance.
Read full news article Announcements
Corporate Actions

No Upcoming Board Meetings

Faze Three Ltd has declared 5% dividend, ex-date: 06 Jun 22

Faze Three Ltd has announced 10:2 stock split, ex-date: 24 Oct 07

No Bonus history available

No Rights history available
Quality key factors
Valuation key factors
Technicals key factors
 Technical Indicator Scale: Bearish, Mildly Bearish, Sideways, Mildly Bullish, Bullish Turned
 Shareholding Snapshot : Mar 2026
Shareholding Compare (%holding)
Promoters
None
Held by 0 Schemes
Held by 3 FIIs (0.15%)
Ajay Brijlal Anand (34.84%)
Ajay Shrikrishan Jindal (11.56%)
35.7%
Quarterly Results Snapshot (Consolidated) - Mar'26 - QoQ

QoQ Growth in quarter ended Mar 2026 is 22.14% vs 9.64% in Dec 2025

QoQ Growth in quarter ended Mar 2026 is 206.25% vs 223.08% in Dec 2025
Half Yearly Results Snapshot (Consolidated) - Sep'25
Growth in half year ended Sep 2025 is 39.09% vs 15.00% in Sep 2024
Growth in half year ended Sep 2025 is -47.32% vs -42.43% in Sep 2024
Nine Monthly Results Snapshot (Consolidated) - Dec'25
YoY Growth in nine months ended Dec 2025 is 34.73% vs 19.80% in Dec 2024
YoY Growth in nine months ended Dec 2025 is -39.89% vs -38.31% in Dec 2024
Annual Results Snapshot (Consolidated) - Mar'26
YoY Growth in year ended Mar 2026 is 33.79% vs 22.22% in Mar 2025
YoY Growth in year ended Mar 2026 is -17.44% vs -12.73% in Mar 2025
About Faze Three Ltd

Company Coordinates


