
Compare Colab Platforms with Similar Stocks
Stock DNA
Non Banking Financial Company (NBFC)
INR 3,357 Cr (Small Cap)
702.00
21
0.01%
0.00
19.67%
136.68
Total Returns (Price + Dividend) 
Latest dividend: 0.01 per share ex-dividend date: Aug-20-2025
Risk Adjusted Returns v/s
Returns Beta

News

Colab Platforms Ltd is Rated Sell
Colab Platforms Ltd is rated 'Sell' by MarketsMOJO, with this rating last updated on 27 Jan 2026. However, the analysis and financial metrics discussed here reflect the stock's current position as of 04 April 2026, providing investors with an up-to-date perspective on the company’s fundamentals, valuation, financial trends, and technical outlook.
Read full news article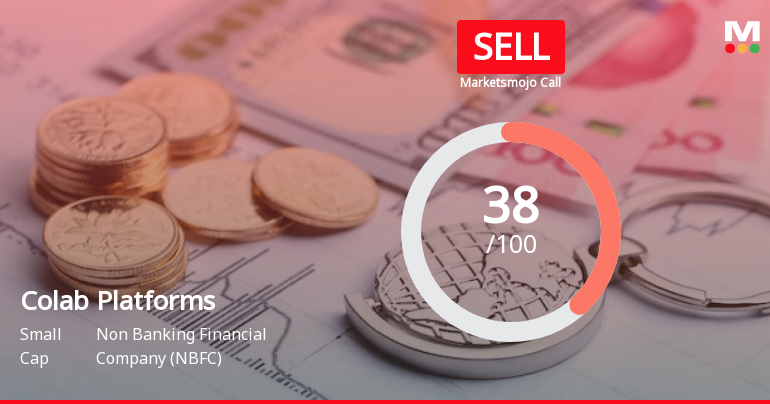
Colab Platforms Ltd is Rated Sell
Colab Platforms Ltd is rated Sell by MarketsMOJO, with this rating last updated on 27 January 2026. However, the analysis and financial metrics discussed here reflect the stock’s current position as of 24 March 2026, providing investors with an up-to-date view of the company’s fundamentals, valuation, financial trends, and technical outlook.
Read full news article
Colab Platforms Ltd Technical Momentum Shifts Amid Mixed Indicator Signals
Colab Platforms Ltd, a small-cap player in the Non Banking Financial Company (NBFC) sector, has experienced a notable shift in its technical momentum, moving from a mildly bullish stance to a sideways trend. This transition is underscored by a complex interplay of technical indicators including MACD, RSI, moving averages, and Bollinger Bands, signalling a nuanced outlook for investors amid recent price fluctuations.
Read full news article Announcements
Announcement under Regulation 30 (LODR)-Change in Directorate
31-Mar-2026 | Source : BSEThis is inform to the exchange that the Company has duly convened its Board Meeting today the Outcome is enclosed herewith for your reference.
Board Meeting Outcome for Outcome Of The Board Meeting Held On Tuesday 31St March 2026
31-Mar-2026 | Source : BSE1. Appointment of Mr. Sudhakar Mishal (DIN: 11639555) as an Additional Director (Non-Executive Independent Director) w.e.f. 31st March 2026. 2. Change in Designation of Mr. Rohit Singh (DIN: 10455367) from Non- Executive Independent Director to Non-Executive Non-Independent Director.
Closure of Trading Window
25-Mar-2026 | Source : BSEEnclosed herewith the intimation of Trading Window Closure for the quarter and year ending 31.03.2026.
Corporate Actions

No Upcoming Board Meetings

Colab Platforms Ltd has declared 1% dividend, ex-date: 20 Aug 25

Colab Platforms Ltd has announced 1:2 stock split, ex-date: 21 May 25

Colab Platforms Ltd has announced 1:1 bonus issue, ex-date: 19 Mar 24

No Rights history available
Quality key factors
Valuation key factors
Technicals key factors
 Technical Indicator Scale: Bearish, Mildly Bearish, Sideways, Mildly Bullish, Bullish Turned
 Shareholding Snapshot : Dec 2025
Shareholding Compare (%holding)
Non Institution
None
Held by 0 Schemes
Held by 1 FIIs (0.13%)
Skybridge Incap Advisory Llp (33.88%)
Moonlight Multitrade Llp (7.05%)
16.8%
Quarterly Results Snapshot (Standalone) - Dec'25 - QoQ

QoQ Growth in quarter ended Dec 2025 is 13.48% vs 84.12% in Sep 2025
QoQ Growth in quarter ended Dec 2025 is -29.30% vs 30.83% in Sep 2025
Half Yearly Results Snapshot (Standalone) - Sep'25
Growth in half year ended Sep 2025 is 144.12% vs 6,944.44% in Sep 2024

Growth in half year ended Sep 2025 is 180.81% vs 41.43% in Sep 2024
Nine Monthly Results Snapshot (Standalone) - Dec'25
YoY Growth in nine months ended Dec 2025 is 121.07% vs 3,183.78% in Dec 2024
YoY Growth in nine months ended Dec 2025 is 103.66% vs 20.89% in Dec 2024
Annual Results Snapshot (Standalone) - Mar'25
YoY Growth in year ended Mar 2025 is 4,241.51% vs 6.00% in Mar 2024
YoY Growth in year ended Mar 2025 is 59.78% vs 110.59% in Mar 2024
About Colab Platforms Ltd

Company Coordinates


