
Compare KG Petrochem with Similar Stocks
Dashboard
Weak Long Term Fundamental Strength with a -25.41% CAGR growth in Operating Profits over the last 5 years
- Low ability to service debt as the company has a high Debt to EBITDA ratio of 4.66 times
- The company has been able to generate a Return on Equity (avg) of 4.22% signifying low profitability per unit of shareholders funds
The company has declared Negative results for the last 3 consecutive quarters
Stock DNA
Garments & Apparels
INR 91 Cr (Micro Cap)
21.00
14
0.00%
0.44
2.39%
0.49
Total Returns (Price + Dividend) 
KG Petrochem for the last several years.
Risk Adjusted Returns v/s
Returns Beta

News

KG Petrochem Ltd is Rated Strong Sell
KG Petrochem Ltd is rated Strong Sell by MarketsMOJO. This rating was last updated on 29 May 2026, reflecting a significant reassessment of the stock’s outlook. However, all fundamentals, returns, and financial metrics discussed below are current as of 09 July 2026, providing investors with the latest perspective on the company’s position.
Read full news article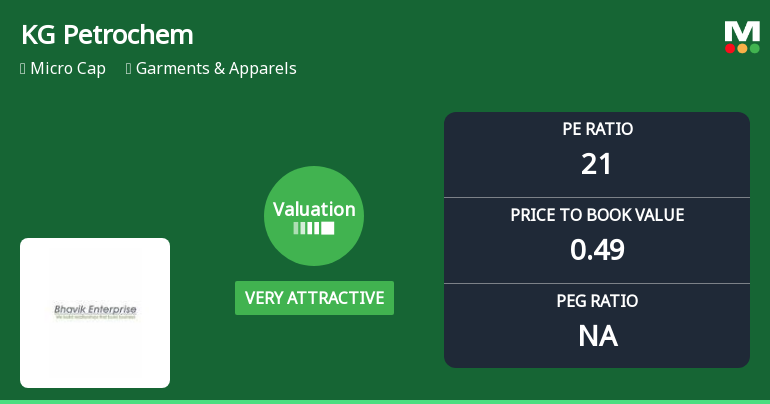
KG Petrochem Ltd Valuation Shifts Signal Renewed Price Attractiveness Amid Sector Challenges
KG Petrochem Ltd, a micro-cap player in the Garments & Apparels sector, has witnessed a significant shift in its valuation parameters, moving from a risky to a very attractive valuation grade. Despite subdued returns relative to the Sensex and sector peers, the stock’s current price-to-earnings (P/E) and price-to-book value (P/BV) ratios suggest a compelling entry point for value-oriented investors.
Read full news article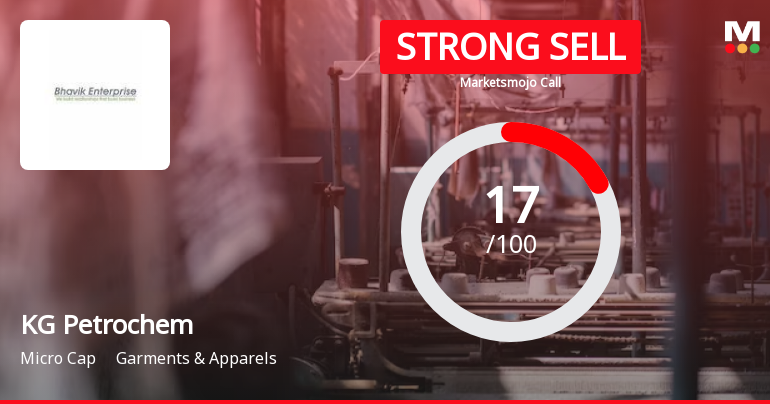
KG Petrochem Ltd is Rated Strong Sell
KG Petrochem Ltd is rated Strong Sell by MarketsMOJO. This rating was last updated on 29 May 2026, reflecting a significant reassessment of the stock’s outlook. However, all fundamentals, returns, and financial metrics discussed below are current as of 28 June 2026, providing investors with the latest perspective on the company’s position.
Read full news article Announcements
Compliances-Certificate under Reg. 74 (5) of SEBI (DP) Regulations 2018
14-Jul-2026 | Source : BSEPlease find attached certificate under Regulation 74(5) of SEBI (DP) Regulations 2018
Closure of Trading Window
30-Jun-2026 | Source : BSETrading Window for trading/ dealing in the shares of the Company will be closed from July 01 2026 til the expiry of 48 hours after the declaration of financial results for the quarter ended June 30 2026 for the Directors Designated Employees Key Managerial Personnel Promoters and other Connected Persons as covered under SEBI (PIT) Regulations 2015
Announcement under Regulation 30 (LODR)-Credit Rating
23-Jun-2026 | Source : BSEAnnouncement under Regulation 30(LODR)- Credit Rating
Corporate Actions

No Upcoming Board Meetings

No Dividend history available

No Splits history available

No Bonus history available

No Rights history available
Quality key factors
Valuation key factors
Technicals key factors
 Technical Indicator Scale: Bearish, Mildly Bearish, Sideways, Mildly Bullish, Bullish Turned
 Shareholding Snapshot : Mar 2026
Shareholding Compare (%holding)
Promoters
None
Held by 0 Schemes
Held by 0 FIIs
Manish Singhal (27.67%)
Sanjay Bansal (4.98%)
20.26%
Quarterly Results Snapshot (Standalone) - Mar'26 - YoY

YoY Growth in quarter ended Mar 2026 is -34.87% vs 18.32% in Mar 2025

YoY Growth in quarter ended Mar 2026 is 235.14% vs -14.94% in Mar 2025
Half Yearly Results Snapshot (Standalone) - Sep'25
Growth in half year ended Sep 2025 is 22.33% vs -5.95% in Sep 2024
Growth in half year ended Sep 2025 is 3.19% vs 186.24% in Sep 2024
Nine Monthly Results Snapshot (Standalone) - Dec'25
YoY Growth in nine months ended Dec 2025 is -7.30% vs 11.22% in Dec 2024
YoY Growth in nine months ended Dec 2025 is -57.73% vs 6,557.14% in Dec 2024
Annual Results Snapshot (Standalone) - Mar'26
YoY Growth in year ended Mar 2026 is -16.44% vs 13.48% in Mar 2025
YoY Growth in year ended Mar 2026 is -19.24% vs 492.47% in Mar 2025
About KG Petrochem Ltd

Company Coordinates


