
Compare Monind with Similar Stocks
Dashboard
With a Negative Book Value, the company has a Weak Long Term Fundamental Strength
- Poor long term growth as Net Sales has grown by an annual rate of % and Operating profit at 0% over the last 5 years
- The company has a negative book value of Rs 54.98 crore
Risky - Not traded in last 10 days
Stock DNA
Iron & Steel Products
INR 10 Cr (Micro Cap)
NA (Loss Making)
14
0.00%
-0.52
1.38%
-0.18
Total Returns (Price + Dividend) 
Monind for the last several years.
Risk Adjusted Returns v/s
Returns Beta

News
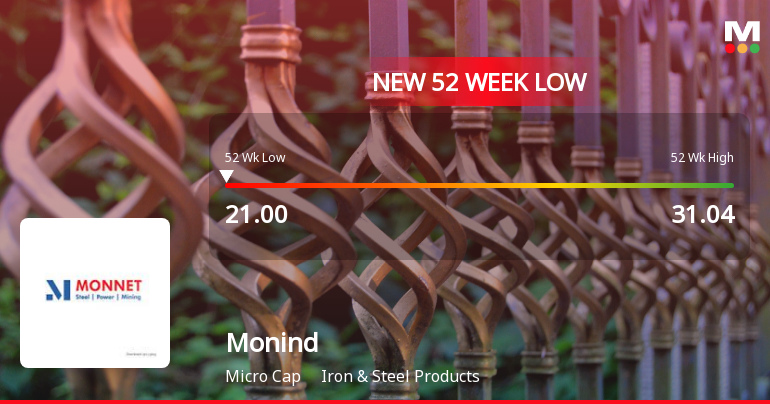
Monind Ltd Falls to 52-Week Low of Rs 21 as Sell-Off Deepens
For the fifth consecutive session, Monind Ltd closed lower, slipping to a fresh 52-week low of Rs 21 on 22 Jun 2026. This decline comes despite a broadly positive market backdrop, with the Sensex gaining 0.55% and several indices hitting new 52-week highs.
Read full news article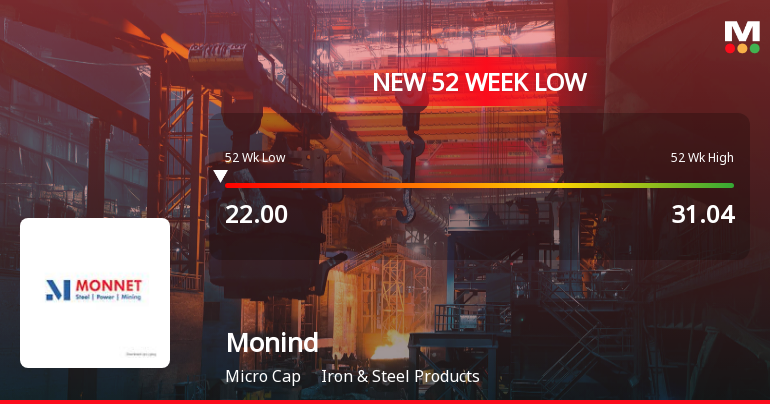
Monind Ltd Falls to 52-Week Low of Rs 23.05 as Sell-Off Deepens
For the second consecutive session, Monind Ltd closed lower, slipping to a fresh 52-week low of Rs 23.05 on 15 Jun 2026. This decline extends the stock’s downward trend, with a 9.68% loss over the past two days, underperforming its sector by 5.64% today alone.
Read full news article Announcements
Compliances-Certificate under Reg. 74 (5) of SEBI (DP) Regulations 2018
06-Jul-2026 | Source : BSECertificate under Regulation 74 (5) of SEBI (Depositories and Participants) Regulations 2018 for the quarter ended June 30 2026
Closure of Trading Window
26-Jun-2026 | Source : BSEClosure of Trading Window
Announcement under Regulation 30 (LODR)-Newspaper Publication
30-May-2026 | Source : BSEIntimation of Newspaper Publication of Audited Financial Results for the quarter and financial year ended March 31 2026.
Corporate Actions

No Upcoming Board Meetings

No Dividend history available

No Splits history available

No Bonus history available

No Rights history available
Quality key factors
Valuation key factors
Technicals key factors
 Technical Indicator Scale: Bearish, Mildly Bearish, Sideways, Mildly Bullish, Bullish Turned
 Shareholding Snapshot : Jun 2026
Shareholding Compare (%holding)
Promoters
None
Held by 0 Schemes
Held by 0 FIIs
Kamdhenu Enterprises Ltd (36.45%)
Icici Bank Ltd (2.04%)
12.08%
Quarterly Results Snapshot (Standalone) - Mar'26 - QoQ
QoQ Growth in quarter ended Mar 2026 is 0.00% vs 0.00% in Dec 2025

QoQ Growth in quarter ended Mar 2026 is 297.06% vs 1.45% in Dec 2025
Half Yearly Results Snapshot (Standalone) - Sep'25
Growth in half year ended Sep 2025 is 0.00% vs 0.00% in Sep 2024
Growth in half year ended Sep 2025 is -12.70% vs -50.00% in Sep 2024
Nine Monthly Results Snapshot (Standalone) - Dec'25
YoY Growth in nine months ended Dec 2025 is 0.00% vs 0.00% in Dec 2024
YoY Growth in nine months ended Dec 2025 is -11.70% vs -33.33% in Dec 2024
Annual Results Snapshot (Standalone) - Mar'26
YoY Growth in year ended Mar 2026 is 0.00% vs 0.00% in Mar 2025
YoY Growth in year ended Mar 2026 is 70.08% vs -28.93% in Mar 2025
About Monind Ltd

Company Coordinates


