
Compare T N Steel Tubes with Similar Stocks
Dashboard
Weak Long Term Fundamental Strength with an average Return on Capital Employed (ROCE) of 2.51%
- Poor long term growth as Net Sales has grown by an annual rate of 12.07% and Operating profit at 15.55% over the last 5 years
- Low ability to service debt as the company has a high Debt to EBITDA ratio of 7.76 times
Stock DNA
Iron & Steel Products
INR 12 Cr (Micro Cap)
196.00
9
0.00%
0.73
0.61%
1.25
Total Returns (Price + Dividend) 
T N Steel Tubes for the last several years.
Risk Adjusted Returns v/s
Returns Beta

News
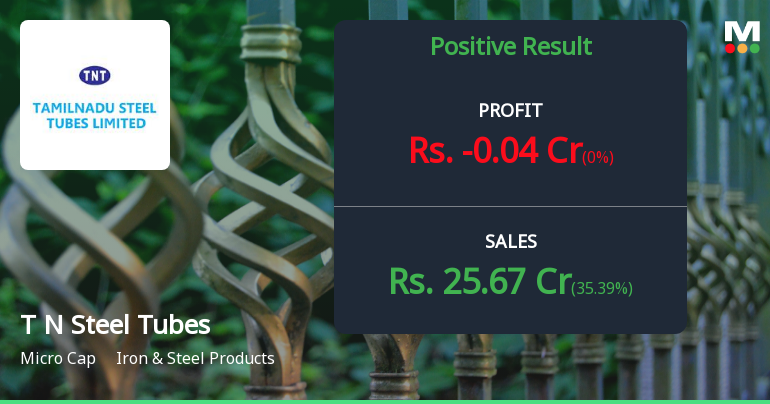
Tamilnadu Steel Tubes Q4 FY26: Micro-Cap Struggles with Profitability Despite Revenue Growth
Tamilnadu Steel Tubes Ltd., a micro-cap player in the iron and steel products sector, reported a challenging quarter for Q4 FY26 (January-March 2026) with a net loss of ₹0.04 crores despite recording its highest-ever quarterly revenue of ₹25.67 crores. The company, with a modest market capitalisation of ₹10.00 crores and currently trading at ₹19.95, witnessed its stock surge 5.00% in the trading session following the results announcement, though the broader picture remains concerning with the stock down 51.76% year-to-date.
Read full news articleAre Tamilnadu Steel Tubes Ltd latest results good or bad?
The latest financial results for Tamilnadu Steel Tubes Ltd for Q3 FY26 reveal a complex operational landscape characterized by significant challenges despite achieving revenue growth. The company reported net sales of ₹18.96 crores, reflecting a year-on-year increase of 17.69%. However, this growth was accompanied by a notable decline of 14.36% compared to the previous quarter. A critical concern is the company's net profit, which fell to ₹0.00 crores, marking a complete erosion of profitability on both a quarter-on-quarter and year-on-year basis. This situation has resulted in a PAT margin of 0.0%, the lowest recorded in eight quarters. The operating margin also contracted to 1.11%, down from 1.85% in the prior quarter, indicating severe margin compression driven by operational headwinds such as rising employee costs and a high effective tax rate. The operational performance highlights a troubling disco...
Read full news article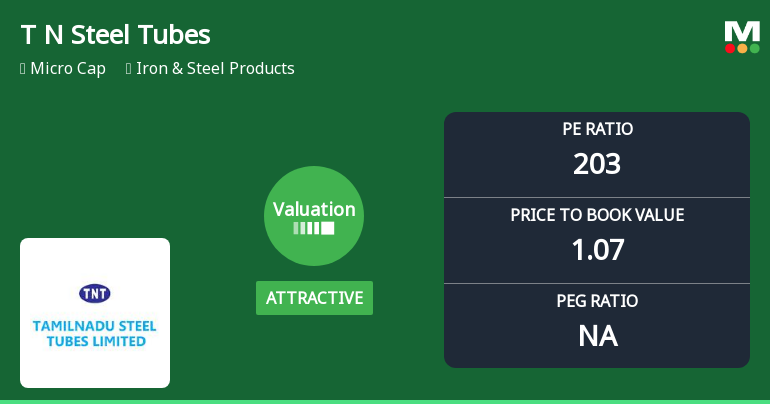
Tamilnadu Steel Tubes Ltd Valuation Shifts Signal Renewed Price Attractiveness
Tamilnadu Steel Tubes Ltd, a micro-cap player in the Iron & Steel Products sector, has witnessed a notable shift in its valuation parameters, moving from a risky to an attractive valuation grade despite ongoing market headwinds and a challenging financial profile. This article analyses the recent changes in key valuation metrics such as the price-to-earnings (P/E) and price-to-book value (P/BV) ratios, compares them with peer averages and historical benchmarks, and assesses the implications for investors.
Read full news article Announcements
Format of the Initial Disclosure to be made by an entity identified as a Large Corporate : Annexure A
23-Jun-2026 | Source : BSEFormat of Initial Disclosure to be made by an entity identified as a Large Corporate.
| Sr. No. | Particulars | Details |
| 1 | Name of Company | Tamilnadu Steel Tubes Ltd |
| 2 | CIN NO. | L27110TN1979PLC007887 |
| 3 | Outstanding borrowing of company as on 31st March / 31st December as applicable (in Rs cr) | 10.31 |
| 4 | Highest Credit Rating during the previous FY | NA |
| 4a | Name of the Credit Rating Agency issuing the Credit Rating mentioned in (4) | Not Applicable |
| 5 | Name of Stock Exchange# in which the fine shall be paid in case of shortfall in the required borrowing under the framework | BSE |
Designation: Company Secretary
EmailId: tnt.share@yahoo.in
Designation: CFO
EmailId: tnt.share@yahoo.in
Date: 23/06/2026
Note: In terms para of 3.2(ii) of the circular beginning F.Y 2022 in the event of shortfall in the mandatory borrowing through debt securities a fine of 0.2% of the shortfall shall be levied by Stock Exchanges at the end of the two-year block period. Therefore an entity identified as LC shall provide in its initial disclosure for a financial year the name of Stock Exchange to which it would pay the fine in case of shortfall in the mandatory borrowing through debt markets.
Announcement under Regulation 30 (LODR)-Newspaper Publication
25-May-2026 | Source : BSEWe have published the Finanicial Results for the QE & FYE 31.03.2026 in the News Paper Viz Makkal Kural (Tamil)and Trinity Mirror(English) and Copies of the news paper clippings are attached for your perusal. Kindly take the same on Records.
Board Meeting Outcome for OUTCOME OF BOARD MEETING HELD ON 23.05.2026
23-May-2026 | Source : BSEOUTCOME OF 1ST BOARD OF DIRECTORS HELD ON 23.05.2026
Corporate Actions

No Upcoming Board Meetings

No Dividend history available

No Splits history available

No Bonus history available

No Rights history available
Quality key factors
Valuation key factors
Technicals key factors
 Technical Indicator Scale: Bearish, Mildly Bearish, Sideways, Mildly Bullish, Bullish Turned
 Shareholding Snapshot : Mar 2026
Shareholding Compare (%holding)
Non Institution
None
Held by 0 Schemes
Held by 0 FIIs
Seema Goyal (4.91%)
Kareetam Traders Ltd (19.61%)
63.25%
Quarterly Results Snapshot (Standalone) - Mar'26 - QoQ

QoQ Growth in quarter ended Mar 2026 is 35.39% vs -14.36% in Dec 2025
QoQ Growth in quarter ended Mar 2026 is 0.00% vs -100.00% in Dec 2025
Half Yearly Results Snapshot (Standalone) - Sep'25
Growth in half year ended Sep 2025 is 26.26% vs -1.81% in Sep 2024

Growth in half year ended Sep 2025 is -23.08% vs 85.71% in Sep 2024
Nine Monthly Results Snapshot (Standalone) - Dec'25
YoY Growth in nine months ended Dec 2025 is 23.68% vs 1.77% in Dec 2024
YoY Growth in nine months ended Dec 2025 is -33.33% vs 114.29% in Dec 2024
Annual Results Snapshot (Standalone) - Mar'26
YoY Growth in year ended Mar 2026 is 24.37% vs 3.30% in Mar 2025
YoY Growth in year ended Mar 2026 is -40.00% vs -64.29% in Mar 2025
About Tamilnadu Steel Tubes Ltd

Company Coordinates


