
Compare Ultramarine Pig. with Similar Stocks
Stock DNA
Dyes And Pigments
INR 1,075 Cr (Micro Cap)
14.00
20
0.00%
0.03
9.06%
1.25
Total Returns (Price + Dividend) 
Latest dividend: 5 per share ex-dividend date: Jul-18-2024
Risk Adjusted Returns v/s
Returns Beta

News
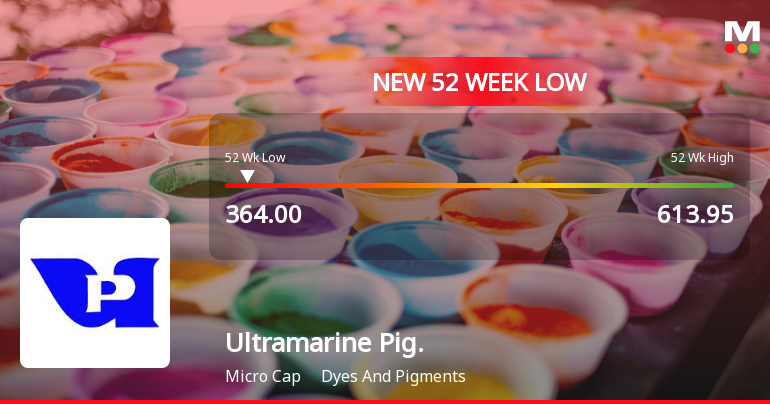
Markets Rally, But Ultramarine & Pigments Ltd Sinks to 52-Week Low in Stock-Specific Sell-Off
Despite broader market resilience, Ultramarine & Pigments Ltd has fallen to a fresh 52-week low of Rs 364 on 19 Jun 2026, marking a 26.67% decline over the past year and signalling persistent headwinds for this micro-cap player in the dyes and pigments sector.
Read full news article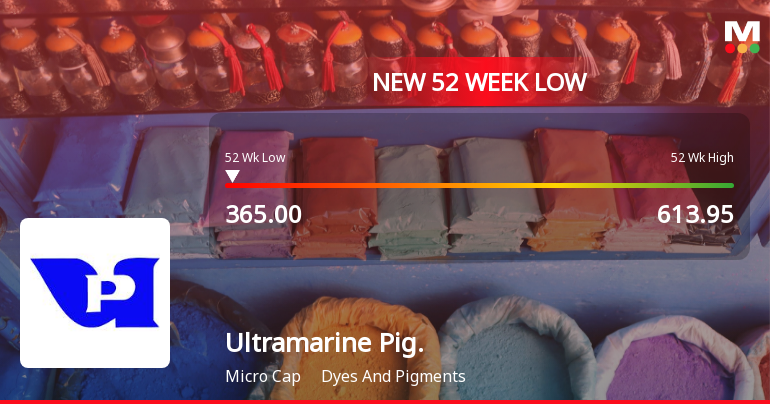
Markets Rally, But Ultramarine & Pigments Ltd Sinks to 52-Week Low in Stock-Specific Sell-Off
Despite a broadly resilient market, Ultramarine & Pigments Ltd has fallen to a fresh 52-week low of Rs 365 on 18 Jun 2026, marking a continuation of its recent downward trajectory with a 4.59% decline over the past three sessions.
Read full news article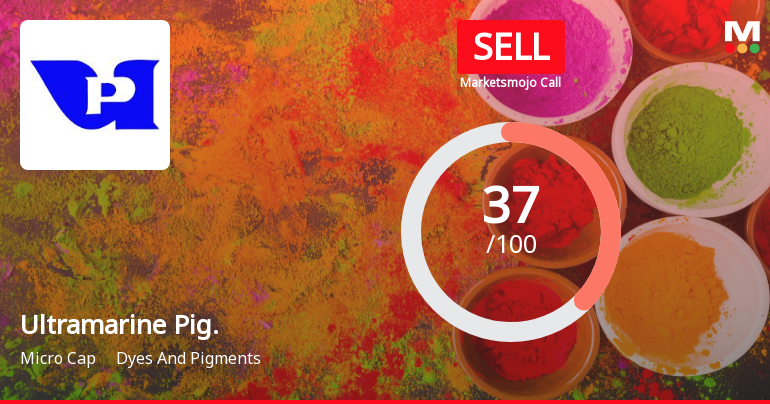
Ultramarine & Pigments Ltd is Rated Sell by MarketsMOJO
Ultramarine & Pigments Ltd is rated 'Sell' by MarketsMOJO, with this rating last updated on 11 February 2026. However, the analysis and financial metrics discussed here reflect the stock's current position as of 17 June 2026, providing investors with an up-to-date view of the company’s fundamentals, returns, and market performance.
Read full news article Announcements
Announcement under Regulation 30 (LODR)-Newspaper Publication
12-Jun-2026 | Source : BSENews paper advertisement: Notice given to Shareholders in accordance with applicable provisions of listing regulations and the Companies Act2013 read with Rules made thereunder inter alia informing convening of 65th Annual General Meeting of the Company through Video Conferencing (VC) / Other Audio Visual Means (OAVM) E -Voting payment of dividend registration of email and bank account details.
Announcement under Regulation 30 (LODR)-Newspaper Publication
06-Jun-2026 | Source : BSENewspaper publication regarding notice to shareholders for the shares to be transferred to IEPF pursuant to the provisions of Investor Education and Protection Fund Authority (Accounting Audit Transfer and Refund) Rules 2016
Compliances-Reg.24(A)-Annual Secretarial Compliance
23-May-2026 | Source : BSEAnnual Secretarial Compliance report for the financial year 2025-26
Corporate Actions

No Upcoming Board Meetings

Ultramarine & Pigments Ltd has declared 300% dividend, ex-date: 14 Jul 26

No Splits history available

No Bonus history available

No Rights history available
Quality key factors
Valuation key factors
Technicals key factors
 Technical Indicator Scale: Bearish, Mildly Bearish, Sideways, Mildly Bullish, Bullish Turned
 Shareholding Snapshot : Mar 2026
Shareholding Compare (%holding)
Non Institution
None
Held by 0 Schemes
Held by 5 FIIs (1.24%)
Thirumalai Chemicals Limited (14.38%)
Shivani Tejas Trivedi (2.08%)
47.61%
Quarterly Results Snapshot (Consolidated) - Mar'26 - YoY

YoY Growth in quarter ended Mar 2026 is 2.02% vs 43.61% in Mar 2025
YoY Growth in quarter ended Mar 2026 is -16.86% vs 56.58% in Mar 2025
Half Yearly Results Snapshot (Consolidated) - Sep'25

Growth in half year ended Sep 2025 is 18.36% vs 16.12% in Sep 2024
Growth in half year ended Sep 2025 is 12.43% vs 4.08% in Sep 2024
Nine Monthly Results Snapshot (Consolidated) - Dec'25
YoY Growth in nine months ended Dec 2025 is 15.22% vs 17.62% in Dec 2024
YoY Growth in nine months ended Dec 2025 is 14.84% vs 24.16% in Dec 2024
Annual Results Snapshot (Consolidated) - Mar'26
YoY Growth in year ended Mar 2026 is 11.52% vs 23.91% in Mar 2025
YoY Growth in year ended Mar 2026 is 7.62% vs 30.30% in Mar 2025
About Ultramarine & Pigments Ltd

Company Coordinates


