
Compare Advanced Enzyme with Similar Stocks
Stock DNA
Pharmaceuticals & Biotechnology
INR 3,937 Cr (Small Cap)
24.00
27
0.35%
-0.41
9.82%
2.38
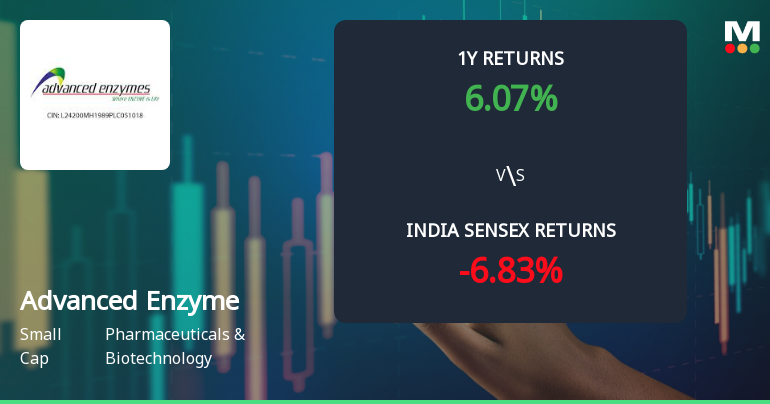
Total Returns (Price + Dividend) 
Latest dividend: 1.2 per share ex-dividend date: Jul-23-2025
Risk Adjusted Returns v/s
Returns Beta

News
Advanced Enzyme Technologies Ltd Sees Mixed Technical Signals Amid Price Momentum Shift
Advanced Enzyme Technologies Ltd, a small-cap player in the Pharmaceuticals & Biotechnology sector, has experienced a notable shift in its technical parameters, reflecting a complex price momentum environment. Despite a recent downgrade from a Sell to a Hold rating by MarketsMOJO on 27 April 2026, the stock’s technical indicators present a nuanced picture, with some signals turning mildly bullish while others remain neutral or mildly bearish. This article analyses the latest technical trends, price movements, and relative performance against the broader market benchmark, Sensex.
Read full news article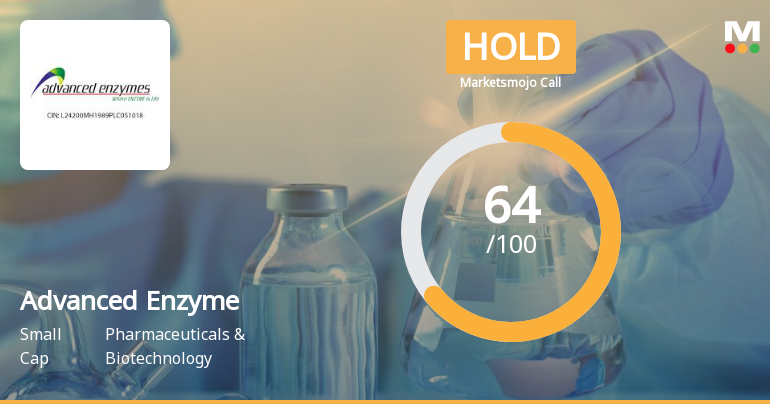
Advanced Enzyme Technologies Ltd is Rated Hold
Advanced Enzyme Technologies Ltd is rated 'Hold' by MarketsMOJO, with this rating last updated on 27 April 2026. However, the analysis and financial metrics presented here reflect the company’s current position as of 22 June 2026, providing investors with an up-to-date view of its fundamentals, returns, and market performance.
Read full news article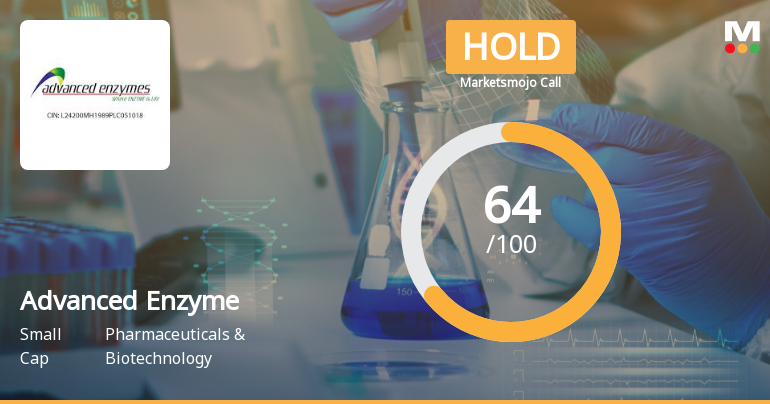
Advanced Enzyme Technologies Ltd is Rated Hold
Advanced Enzyme Technologies Ltd is rated 'Hold' by MarketsMOJO, with this rating last updated on 27 April 2026. However, the analysis and financial metrics presented here reflect the stock's current position as of 11 June 2026, providing investors with the latest insights into its performance and outlook.
Read full news article Announcements
Closure of Trading Window
25-Jun-2026 | Source : BSEPlease find enclosed herewith the intimation regarding closure of trading window with effect from July 01 2026.
Announcement under Regulation 30 (LODR)-Newspaper Publication
12-Jun-2026 | Source : BSENewspaper Publication - Notice to Equity Shareholders of the Company regarding transfer of shares to the Investor Education and Protection Fund (IEPF) and Unclaimed Dividend thereto / Second 100 days Campaign - Saksham Niveshak for KYC and other related updation and shareholders engagement to prevent transfer of unpaid / uncalimed dividend to IEPF / Special window for transfer and dematerialisation of physical securities
Announcement under Regulation 30 (LODR)-Change in Directorate
11-Jun-2026 | Source : BSEPlease find enclosed herewith intimation regarding completion of second term of Ms. Rajshree Patel as Independent Director of the Company.
Corporate Actions

No Upcoming Board Meetings

Advanced Enzyme Technologies Ltd has declared 60% dividend, ex-date: 23 Jul 25

Advanced Enzyme Technologies Ltd has announced 2:10 stock split, ex-date: 25 May 17

No Bonus history available

No Rights history available
Quality key factors
Valuation key factors
Technicals key factors
 Technical Indicator Scale: Bearish, Mildly Bearish, Sideways, Mildly Bullish, Bullish Turned
 Shareholding Snapshot : Mar 2026
Shareholding Compare (%holding)
Promoters
None
Held by 9 Schemes (1.93%)
Held by 68 FIIs (25.49%)
Vasant Rathi (26.47%)
Orbimed Asia Iii Mauritius Fvci Limited (12.07%)
17.57%
Quarterly Results Snapshot (Consolidated) - Mar'26 - YoY

YoY Growth in quarter ended Mar 2026 is 21.65% vs 5.93% in Mar 2025
YoY Growth in quarter ended Mar 2026 is 62.24% vs -6.46% in Mar 2025
Half Yearly Results Snapshot (Consolidated) - Sep'25
Growth in half year ended Sep 2025 is 23.23% vs -1.47% in Sep 2024
Growth in half year ended Sep 2025 is 24.29% vs 5.96% in Sep 2024
Nine Monthly Results Snapshot (Consolidated) - Dec'25
YoY Growth in nine months ended Dec 2025 is 15.47% vs 0.79% in Dec 2024
YoY Growth in nine months ended Dec 2025 is 20.18% vs -0.33% in Dec 2024
Annual Results Snapshot (Consolidated) - Mar'26
YoY Growth in year ended Mar 2026 is 17.09% vs 2.09% in Mar 2025
YoY Growth in year ended Mar 2026 is 28.68% vs -1.64% in Mar 2025
About Advanced Enzyme Technologies Ltd

Company Coordinates


