
Compare Creative Casting with Similar Stocks
Stock DNA
Castings & Forgings
INR 75 Cr (Micro Cap)
17.00
50
1.73%
-0.43
9.59%
1.65
Total Returns (Price + Dividend) 
Latest dividend: 10 per share ex-dividend date: Sep-18-2025
Risk Adjusted Returns v/s
Returns Beta

News
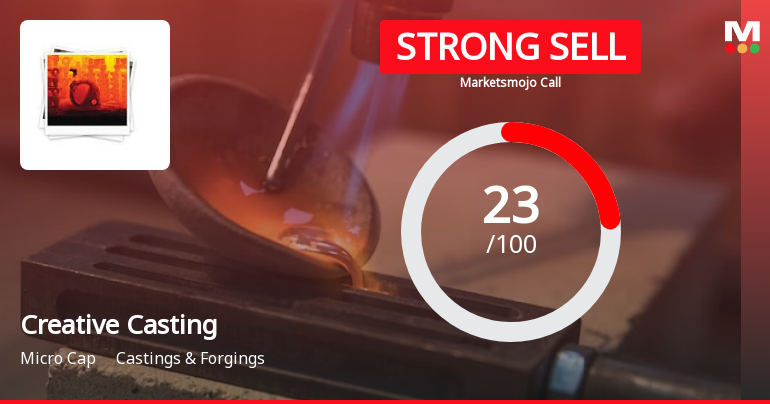
Creative Castings Ltd is Rated Strong Sell
Creative Castings Ltd is rated Strong Sell by MarketsMOJO. This rating was last updated on 16 May 2026. However, the analysis and financial metrics presented here reflect the stock’s current position as of 10 July 2026, providing investors with the most up-to-date view of the company’s fundamentals, returns, and market performance.
Read full news article
Creative Castings Ltd is Rated Strong Sell
Creative Castings Ltd is rated Strong Sell by MarketsMOJO. This rating was last updated on 16 May 2026. However, the analysis and financial metrics discussed below reflect the stock’s current position as of 29 June 2026, providing investors with the latest insights into the company’s performance and outlook.
Read full news article
Creative Castings Ltd is Rated Strong Sell
Creative Castings Ltd is rated Strong Sell by MarketsMOJO, with this rating last updated on 16 May 2026. However, the analysis and financial metrics discussed here reflect the stock’s current position as of 17 June 2026, providing investors with the most up-to-date insight into the company’s performance and outlook.
Read full news article Announcements
Compliances-Certificate under Reg. 74 (5) of SEBI (DP) Regulations 2018
15-Jul-2026 | Source : BSECertificate under Regulation 74(5) of SEBI (DP) Regulations 2018 for the quarter ended June 30 2026 is enclosed hereto.
Disclosure Under Regulation 7(2)(B) Of SEBI (Prohibition Of Insider Trading) Regulations 2015
30-Jun-2026 | Source : BSEPursuant to Regulation 7(2)(b) of SEBI (Prohibition of Insider Trading) Regulations 2015 please find enclosed the disclosures received by the Company in Form C from members of the Promoter / Promoter Group in respect of off-market inter-se transfer of equity shares by way of gift.
Closure of Trading Window
25-Jun-2026 | Source : BSEPursuant to Companys Code for Prevention of Insider Trading read with Regulation 9 (Clause 4 of Schedule B) of the SEBI (Prohibition of Insider Trading) (Amendment) Regulation 2018 the Trading Window for dealing in the securities of the Company for all the Designated Persons (including their immediate relatives) shall remain closed with effect from July 1 2026 till 48 hours after the declaration of unaudited financial results for the 1st quarter ended on June 30 2026.
Corporate Actions

No Upcoming Board Meetings

Creative Castings Ltd has declared 100% dividend, ex-date: 18 Sep 25

No Splits history available

No Bonus history available

No Rights history available
Quality key factors
Valuation key factors
Technicals key factors
 Technical Indicator Scale: Bearish, Mildly Bearish, Sideways, Mildly Bullish, Bullish Turned
 Shareholding Snapshot : Dec 2025
Shareholding Compare (%holding)
Promoters
None
Held by 0 Schemes
Held by 0 FIIs
Rajan R Bambhania (6.52%)
Keyur Mansukhbhai Thanki And Vishal Prabhudas Abhani (4.22%)
22.81%
Quarterly Results Snapshot (Standalone) - Mar'26 - QoQ

QoQ Growth in quarter ended Mar 2026 is -22.30% vs 16.19% in Dec 2025
QoQ Growth in quarter ended Mar 2026 is -35.03% vs 50.96% in Dec 2025
Half Yearly Results Snapshot (Standalone) - Sep'25
Growth in half year ended Sep 2025 is -9.37% vs -0.37% in Sep 2024
Growth in half year ended Sep 2025 is -10.55% vs -9.13% in Sep 2024
Nine Monthly Results Snapshot (Standalone) - Dec'25

YoY Growth in nine months ended Dec 2025 is 12.04% vs -11.06% in Dec 2024
YoY Growth in nine months ended Dec 2025 is 29.84% vs -19.88% in Dec 2024
Annual Results Snapshot (Standalone) - Mar'26
YoY Growth in year ended Mar 2026 is 10.96% vs -16.74% in Mar 2025
YoY Growth in year ended Mar 2026 is 20.39% vs -28.40% in Mar 2025
About Creative Castings Ltd

Company Coordinates


