
Compare Jindal Leasefin with Similar Stocks
Dashboard
Weak Long Term Fundamental Strength with an average Return on Equity (ROE) of 4.34%
Positive results in Mar 26
With ROE of -4.4, it has a Very Expensive valuation with a 4 Price to Book Value
Majority shareholders : Promoters
Market Beating performance in long term as well as near term
Stock DNA
Non Banking Financial Company (NBFC)
INR 24 Cr (Micro Cap)
NA (Loss Making)
21
0.00%
0.84
-4.40%
3.81
Total Returns (Price + Dividend) 
Jindal Leasefin for the last several years.
Risk Adjusted Returns v/s
Returns Beta

News

Broad-Based Technical Strength Lifts Jindal Leasefin Ltd to 52-Week High of Rs 84.65
Surging past its previous peaks, Jindal Leasefin Ltd touched a new 52-week high of Rs 84.65 on 23 Jun 2026, marking a remarkable 102.03% gain over the past year. This rally stands in stark contrast to the broader market, with the Sensex declining 6.96% over the same period, underscoring the stock's exceptional momentum despite a bearish market backdrop.
Read full news article
Jindal Leasefin Ltd is Rated Hold by MarketsMOJO
Jindal Leasefin Ltd is rated 'Hold' by MarketsMOJO, a rating that was last updated on 27 Apr 2026. While this rating change reflects the company's evolving outlook, the analysis and financial metrics presented here are based on the stock's current position as of 15 May 2026, providing investors with the most up-to-date perspective on its performance and prospects.
Read full news article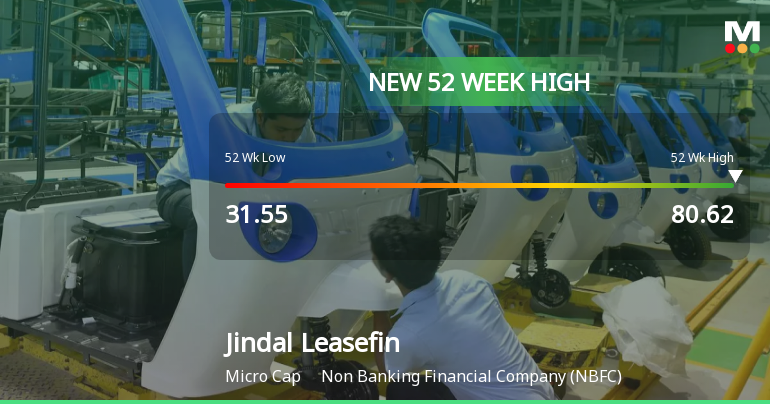
Broad-Based Technical Strength Lifts Jindal Leasefin Ltd to 52-Week High of Rs 80.62
Surging past its previous peaks, Jindal Leasefin Ltd touched a fresh 52-week high of Rs 80.62 on 12 May 2026, marking an impressive 85.33% gain over the past year. This rally stands in stark contrast to the broader Sensex, which has declined by 8.57% over the same period, underscoring the stock’s exceptional momentum despite a bearish market backdrop.
Read full news article Announcements
Draft Letter of Offer
05-May-2026 | Source : BSERarever Financial Advisors Pvt. Ltd. (Manager to the Offer) has submitted to BSE a copy of Draft Letter of Offer for the attention of the Public Shareholders of Jindal Leasefin Ltd (Target Company).
Detailed Public Statement
27-Apr-2026 | Source : BSERarever Financial Advisors Pvt. Ltd. (Manager to the Offer) has submitted to BSE a copy of Detailed Public Statement in terms of Regulations 3(1) and 4 read with Regulations 13(4) 14(3) and 15(2) and other applicable Regulations of Securities and Exchange Board of India (Substantial Acquisition of Shares and Takeovers) Regulations 2011 and subsequent amendments thereof for the attention of the Public Shareholders of Jindal Leasefin Ltd (Target Company).
Public Announcement - Open Offer
20-Apr-2026 | Source : BSERarever Financial Advisors Pvt. Ltd. (Manager to the Offer) has submitted to BSE a copy of Public Announcement under Regulations 3(1) and 4 read with Regulation 13 14 and 15(1) and other applicable provisions of the Securities and Exchange Board of India (Substantial Acquisition of Shares and Takeovers) Regulations 2011 and subsequent amendments thereto for the attention of the public shareholders of Jindal Leasefin Ltd (Target Company).
Corporate Actions

No Upcoming Board Meetings

No Dividend history available

No Splits history available

No Bonus history available

No Rights history available
Quality key factors
Valuation key factors
Technicals key factors
 Technical Indicator Scale: Bearish, Mildly Bearish, Sideways, Mildly Bullish, Bullish Turned
 Shareholding Snapshot : Mar 2026
Shareholding Compare (%holding)
Promoters
None
Held by 0 Schemes
Held by 0 FIIs
Jindal Exports And Imports P Ltd (26.85%)
Guttikonda Vara Lakshmi (1.13%)
24.29%
Quarterly Results Snapshot (Standalone) - Mar'26 - QoQ
QoQ Growth in quarter ended Mar 2026 is 0.00% vs 0.00% in Dec 2025

QoQ Growth in quarter ended Mar 2026 is 690.00% vs -900.00% in Dec 2025
Half Yearly Results Snapshot (Standalone) - Sep'25
Growth in half year ended Sep 2025 is 0.00% vs 0.00% in Sep 2024
Growth in half year ended Sep 2025 is 28.57% vs -40.00% in Sep 2024
Nine Monthly Results Snapshot (Standalone) - Dec'25
YoY Growth in nine months ended Dec 2025 is 0.00% vs 0.00% in Dec 2024
YoY Growth in nine months ended Dec 2025 is 78.07% vs -1,528.57% in Dec 2024
Annual Results Snapshot (Standalone) - Mar'26
YoY Growth in year ended Mar 2026 is 0.00% vs 0.00% in Mar 2025
YoY Growth in year ended Mar 2026 is 138.66% vs -1,387.50% in Mar 2025
About Jindal Leasefin Ltd

Company Coordinates


