
Compare Parmeshwari Silk with Similar Stocks
Dashboard
High Debt company with Weak Long Term Fundamental Strength
- Poor long term growth as Operating profit has grown by an annual rate 16.04% of over the last 5 years
- High Debt Company with a Debt to Equity ratio (avg) of 2.21 times
Flat results in Mar 26
With ROCE of 10.5, it has a Very Attractive valuation with a 1.2 Enterprise value to Capital Employed
Majority shareholders : Promoters
Market Beating Performance
Stock DNA
Garments & Apparels
INR 117 Cr (Micro Cap)
12.00
26
0.00%
2.14
14.45%
1.72
Total Returns (Price + Dividend) 
Parmeshwari Silk for the last several years.
Risk Adjusted Returns v/s
Returns Beta

News
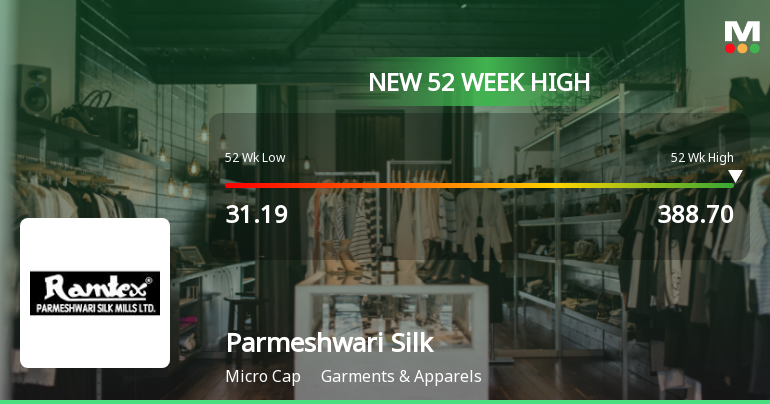
Broad-Based Technical Strength Lifts Parmeshwari Silk Mills Ltd to 52-Week High of Rs 388.7
Surging from a 52-week low of Rs 31.19 to a fresh peak of Rs 388.7 on 7 Jul 2026, Parmeshwari Silk Mills Ltd has delivered an extraordinary 1146.23% return over the past year, vastly outperforming the Sensex’s decline of 5.86%. This remarkable rally is underpinned by a confluence of bullish technical indicators and sustained price momentum that has propelled the stock to new heights.
Read full news article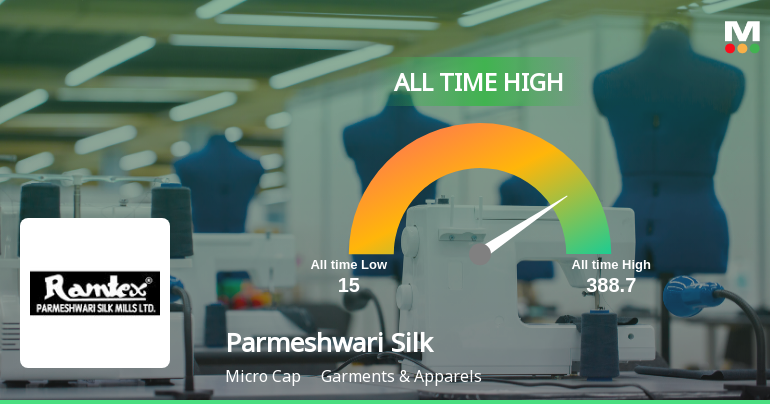
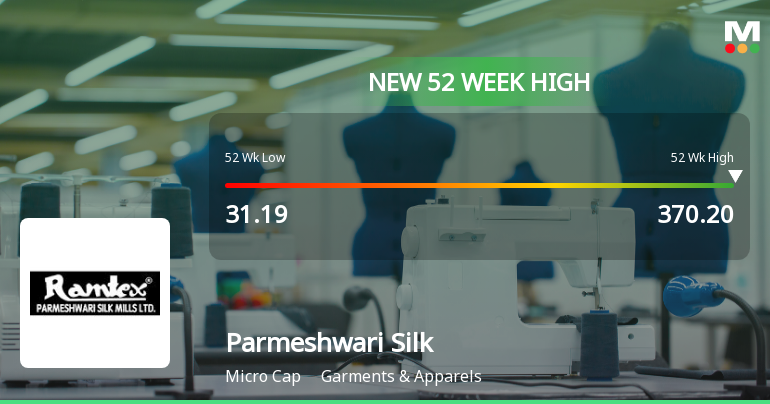
Broad-Based Technical Strength Lifts Parmeshwari Silk Mills Ltd to 52-Week High of Rs 370.2
Surging from a 52-week low of Rs 31.19 to a fresh peak of Rs 370.2, Parmeshwari Silk Mills Ltd has delivered an extraordinary 1086.92% return over the past year, dramatically outpacing the Sensex’s decline of 6.21%. This remarkable rally culminated in a new all-time high on 6 Jul 2026, fuelled by a confluence of robust technical signals and sustained price momentum.
Read full news article Announcements
Closure of Trading Window
25-Jun-2026 | Source : BSEIntimation for closure of Trading Window for Quarter Ended June 302026.
Announcement under Regulation 30 (LODR)-Newspaper Publication
02-Jun-2026 | Source : BSENewspaper Publication for Audited Standalone & Consolidated Financial Results for the quarter & year ended 31st March 2026
Board Meeting Outcome for Approval Of Audited Standalone And Consolidated Financial Results For Quarter And Year Ended 31St March 2026
29-May-2026 | Source : BSEApproval of Audited Standalone and Consolidated Financial Results for quarter and year ended 31st March 2026
Corporate Actions

No Upcoming Board Meetings

No Dividend history available

No Splits history available

No Bonus history available

No Rights history available
Quality key factors
Valuation key factors
Technicals key factors
 Technical Indicator Scale: Bearish, Mildly Bearish, Sideways, Mildly Bullish, Bullish Turned
 Shareholding Snapshot : Mar 2026
Shareholding Compare (%holding)
Promoters
None
Held by 0 Schemes
Held by 0 FIIs
Jatinder Pal Singh (23.47%)
Asees Kaur (5.28%)
39.8%
Quarterly Results Snapshot (Consolidated) - Mar'26 - YoY

YoY Growth in quarter ended Mar 2026 is 9.03% vs 15.44% in Mar 2025
YoY Growth in quarter ended Mar 2026 is 26.44% vs 28.40% in Mar 2025
Half Yearly Results Snapshot (Consolidated) - Sep'25
Growth in half year ended Sep 2025 is 4.22% vs 13.51% in Sep 2024
Growth in half year ended Sep 2025 is 9.09% vs 33.68% in Sep 2024
Nine Monthly Results Snapshot (Consolidated) - Dec'25
YoY Growth in nine months ended Dec 2025 is 5.92% vs 14.50% in Dec 2024
YoY Growth in nine months ended Dec 2025 is 11.74% vs 48.75% in Dec 2024
Annual Results Snapshot (Consolidated) - Mar'26
YoY Growth in year ended Mar 2026 is 6.71% vs 14.74% in Mar 2025
YoY Growth in year ended Mar 2026 is 15.26% vs 43.45% in Mar 2025
About Parmeshwari Silk Mills Ltd

Company Coordinates


