
Compare Darshan Orna with Similar Stocks
Dashboard
Weak Long Term Fundamental Strength as the company has not declared results in the last 6 months
- Poor long term growth as Operating profit has grown by an annual rate 2.29% of over the last 5 years
- Company's ability to service its debt is weak with a poor EBIT to Interest (avg) ratio of 0.08
Below par performance in long term as well as near term
Stock DNA
Gems, Jewellery And Watches
INR 22 Cr (Micro Cap)
39.00
48
0.00%
0.23
2.87%
1.11
Total Returns (Price + Dividend) 
Latest dividend: 0.20000000000000004 per share ex-dividend date: Aug-20-2018
Risk Adjusted Returns v/s
Returns Beta

News

Darshan Orna Ltd Upgraded to Sell on Technical Improvement Despite Lingering Fundamental Concerns
Darshan Orna Ltd, a micro-cap player in the Gems, Jewellery and Watches sector, has seen its investment rating upgraded from Strong Sell to Sell as of 1 July 2026. This change is primarily driven by a shift in technical indicators, despite ongoing fundamental challenges and persistent underperformance against benchmark indices.
Read full news article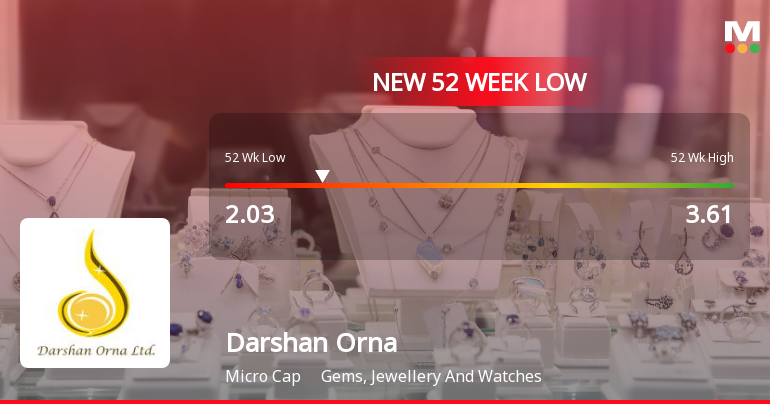
Darshan Orna Ltd Falls to 52-Week Low of Rs 2.03 as Sell-Off Deepens
A sharp decline in Darshan Orna Ltd has pushed the stock to a fresh 52-week low of Rs 2.03 on 15 Jun 2026, marking a significant underperformance amid a broadly positive market backdrop.
Read full news article
Darshan Orna Ltd Downgraded to Strong Sell Amid Weak Fundamentals and Bearish Technicals
Darshan Orna Ltd, a micro-cap player in the Gems, Jewellery and Watches sector, has seen its investment rating downgraded from Sell to Strong Sell as of 10 June 2026. This shift reflects deteriorating technical indicators, weak long-term financial trends, and a challenging valuation backdrop, signalling caution for investors amid a tough operating environment.
Read full news article Announcements
Closure of Trading Window
25-Jun-2026 | Source : BSEThe trading window for dealing in the shares of the company for all designated persons will be closed from July 01 2026 untill the end of 48 hours after declaration of Unaudited Standalone Financial results for the quarter ended June 30 2026.
Compliances-Reg.24(A)-Annual Secretarial Compliance
29-May-2026 | Source : BSEThe Annual Secretarial Compliance Report under Regulation 24A of SEBI(LODR) Regulations 2015 for the Financial Year ended 31st March 2026 is enclosed herewith.
Financial Result For The March 31 2026
28-May-2026 | Source : BSEFinancial Result for March 31 2026
Corporate Actions

No Upcoming Board Meetings

Darshan Orna Ltd has declared 2% dividend, ex-date: 20 Aug 18

Darshan Orna Ltd has announced 2:10 stock split, ex-date: 13 Jun 22

Darshan Orna Ltd has announced 11:10 bonus issue, ex-date: 19 Sep 18

Darshan Orna Ltd has announced 1:1 rights issue, ex-date: 31 Oct 25
Quality key factors
Valuation key factors
Technicals key factors
 Technical Indicator Scale: Bearish, Mildly Bearish, Sideways, Mildly Bullish, Bullish Turned
 Shareholding Snapshot : Mar 2026
Shareholding Compare (%holding)
Non Institution
None
Held by 0 Schemes
Held by 0 FIIs
Kriyansh Gold Private Limited (18.97%)
Vivid Mercantile Limited (18.46%)
26.26%
Quarterly Results Snapshot (Standalone) - Dec'25 - YoY

YoY Growth in quarter ended Dec 2025 is 944.58% vs -85.02% in Dec 2024
YoY Growth in quarter ended Dec 2025 is -18.18% vs -91.97% in Dec 2024
Half Yearly Results Snapshot (Standalone) - Sep'25

Growth in half year ended Sep 2025 is 93.76% vs 115.64% in Sep 2024
Growth in half year ended Sep 2025 is 40.62% vs -69.23% in Sep 2024
Nine Monthly Results Snapshot (Standalone) - Dec'25
YoY Growth in nine months ended Dec 2025 is 247.40% vs -36.92% in Dec 2024
YoY Growth in nine months ended Dec 2025 is 25.58% vs -82.16% in Dec 2024
Annual Results Snapshot (Standalone) - Mar'25
YoY Growth in year ended Mar 2025 is 3.93% vs 59.31% in Mar 2024
YoY Growth in year ended Mar 2025 is -82.40% vs 237.97% in Mar 2024
About Darshan Orna Ltd

Company Coordinates


