
Compare Umiya Tubes with Similar Stocks
Dashboard
Weak Long Term Fundamental Strength with a -8.24% CAGR growth in Net Sales over the last 5 years
- Company's ability to service its debt is weak with a poor EBIT to Interest (avg) ratio of -1.22
- The company has been able to generate a Return on Equity (avg) of 4.22% signifying low profitability per unit of shareholders funds
With ROE of 18.7, it has a Expensive valuation with a 2.6 Price to Book Value
Reducing Promoter Confidence
Stock DNA
Iron & Steel Products
INR 49 Cr (Micro Cap)
14.00
26
0.00%
-0.01
18.73%
2.62
Total Returns (Price + Dividend) 
Umiya Tubes for the last several years.
Risk Adjusted Returns v/s
Returns Beta

News
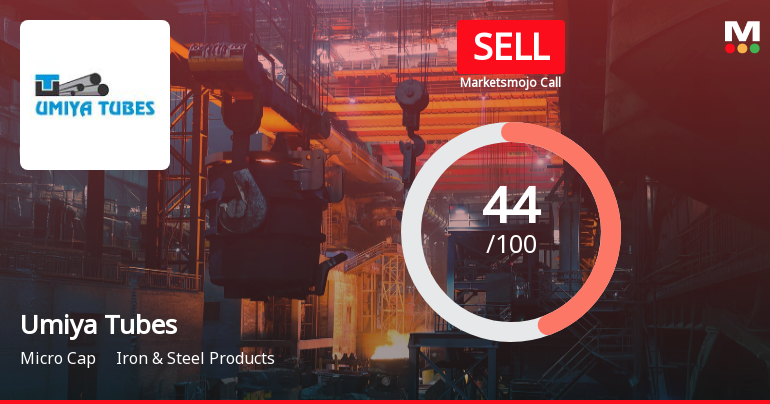
Umiya Tubes Ltd Downgraded to Sell Amid Mixed Technicals and Valuation Concerns
Umiya Tubes Ltd, a micro-cap player in the Iron & Steel Products sector, has seen its investment rating downgraded from Hold to Sell as of 19 June 2026. This shift reflects a nuanced reassessment across four critical parameters: quality, valuation, financial trend, and technical indicators. Despite impressive stock returns over the past year, concerns over long-term fundamentals and recent technical signals have prompted a more cautious stance.
Read full news article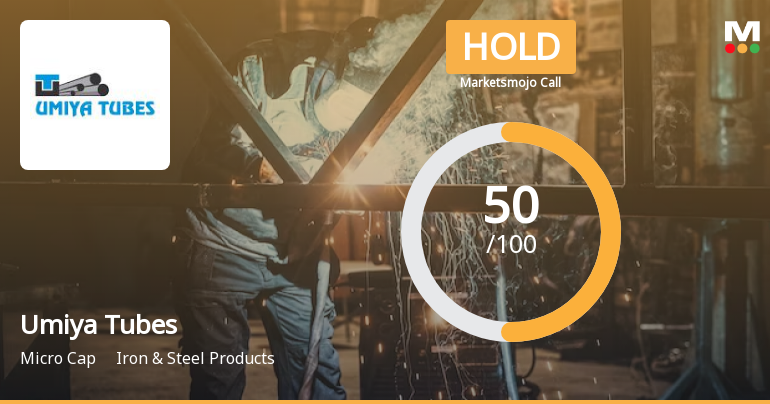
Umiya Tubes Ltd is Rated Hold by MarketsMOJO
Umiya Tubes Ltd is rated 'Hold' by MarketsMOJO, with this rating last updated on 25 May 2026. While the rating change occurred on that date, the analysis and financial metrics discussed below reflect the company’s current position as of 18 June 2026, providing investors with the most up-to-date view of the stock’s fundamentals, returns, and technical outlook.
Read full news article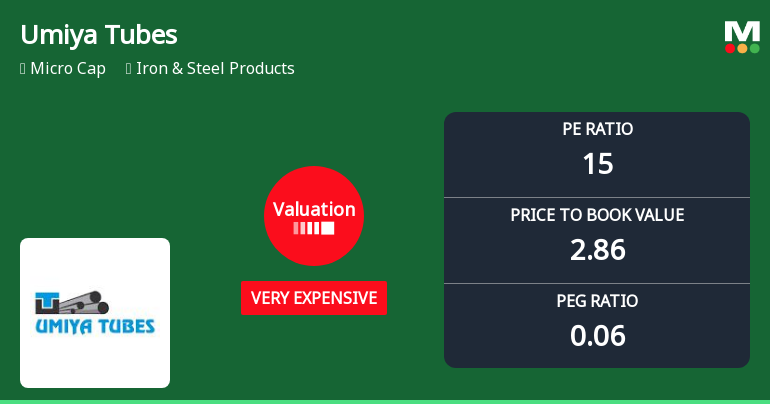
Umiya Tubes Ltd Valuation Shifts Amid Strong Market Performance
Umiya Tubes Ltd, a micro-cap player in the Iron & Steel Products sector, has witnessed a notable shift in its valuation parameters, moving from an expensive to a very expensive rating. This change comes alongside a robust price rally that has significantly outperformed the broader market indices over multiple time horizons.
Read full news article Announcements
Receipt Of Reclassification Request From The Promoter And Promoter Group Members Of The Company.
31-May-2026 | Source : BSECompany has received reclassification request from the Promoter and Promoter Group Members of the Company on 30th May 2026 for their reclassification into Public category.
Board Meeting Outcome for Results - Outcome Of Board Meeting
30-May-2026 | Source : BSEOutcome of Board Meeting - Results for Quarter and Financial year ended on 31st March 2026
Results - March 2026
30-May-2026 | Source : BSEResults March 2026
Corporate Actions

No Upcoming Board Meetings

No Dividend history available

No Splits history available

Umiya Tubes Ltd has announced 1:3 bonus issue, ex-date: 20 Jun 18

No Rights history available
Quality key factors
Valuation key factors
Technicals key factors
 Technical Indicator Scale: Bearish, Mildly Bearish, Sideways, Mildly Bullish, Bullish Turned
 Shareholding Snapshot : Mar 2026
Shareholding Compare (%holding)
Non Institution
None
Held by 0 Schemes
Held by 0 FIIs
None
Kajal Gopal Baldha (8.47%)
87.05%
Quarterly Results Snapshot (Standalone) - Mar'26 - YoY

YoY Growth in quarter ended Mar 2026 is 0.00% vs -100.00% in Mar 2025
YoY Growth in quarter ended Mar 2026 is 310.64% vs 129.56% in Mar 2025
Half Yearly Results Snapshot (Standalone) - Sep'25

Growth in half year ended Sep 2025 is -64.91% vs 26.67% in Sep 2024
Growth in half year ended Sep 2025 is 84.36% vs -37.01% in Sep 2024
Nine Monthly Results Snapshot (Standalone) - Dec'25
YoY Growth in nine months ended Dec 2025 is 694.74% vs 26.67% in Dec 2024
YoY Growth in nine months ended Dec 2025 is 139.73% vs -20.99% in Dec 2024
Annual Results Snapshot (Standalone) - Mar'26
YoY Growth in year ended Mar 2026 is 2,138.60% vs 7.55% in Mar 2025
YoY Growth in year ended Mar 2026 is 261.85% vs 49.12% in Mar 2025
About Umiya Tubes Ltd

Company Coordinates


