
Compare NINtec Systems with Similar Stocks
Dashboard
The company is Net-Debt Free
Healthy long term growth as Net Sales has grown by an annual rate of 43.10% and Operating profit at 47.86%
The company has declared Positive results for the last 11 consecutive quarters
With ROE of 34.9, it has a Very Expensive valuation with a 18.4 Price to Book Value
Despite the size of the company, domestic mutual funds hold only 0% of the company
Market Beating performance in long term as well as near term
Stock DNA
Computers - Software & Consulting
INR 1,672 Cr (Micro Cap)
53.00
20
0.00%
-0.80
34.93%
18.37
Total Returns (Price + Dividend) 
NINtec Systems for the last several years.
Risk Adjusted Returns v/s
Returns Beta

News
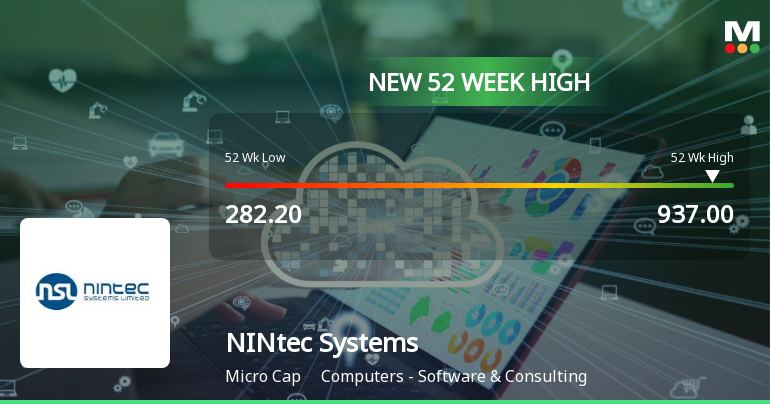
Broad-Based Technical Strength Lifts NINtec Systems Ltd to 52-Week High of Rs 937
With a decisive break above Rs 937 on 20 Jul 2026, NINtec Systems Ltd has reached a new 52-week and all-time high, marking a remarkable 98.7% gain over the past year. This surge comes amid a backdrop of mixed market conditions, with the Sensex retreating by 0.62% on the same day, underscoring the stock's relative strength and technical momentum.
Read full news article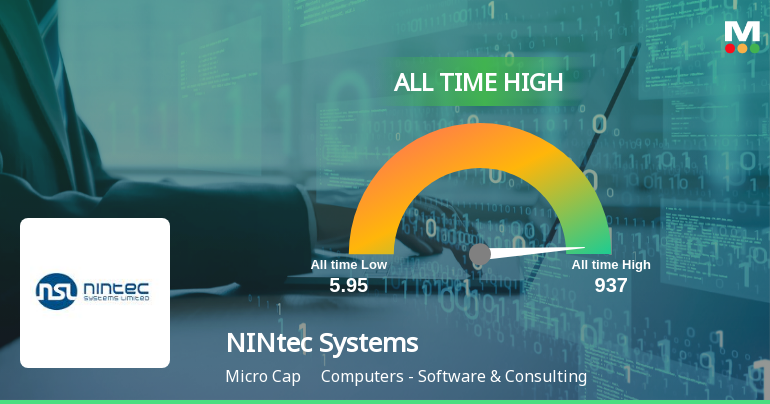
NINtec Systems Ltd Hits All-Time High of Rs 937 as Momentum Builds Across Timeframes
Extending its winning streak to three sessions, NINtec Systems Ltd touched a fresh all-time high of Rs 937 on 20 Jul 2026, outperforming its sector and the broader market with a steady upward trajectory.
Read full news article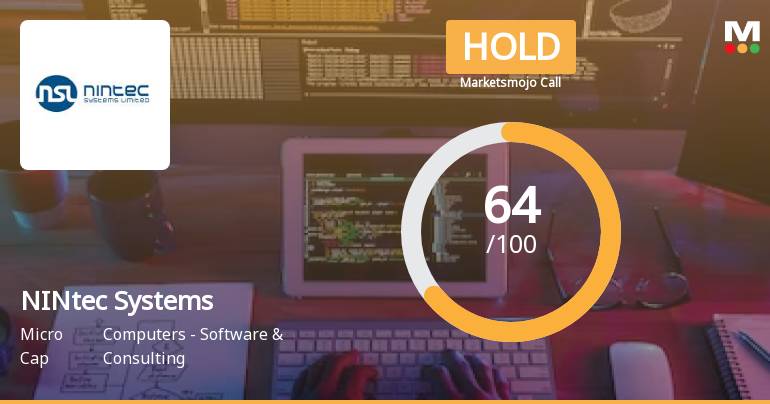
NINtec Systems Ltd is Rated Hold by MarketsMOJO
NINtec Systems Ltd is rated 'Hold' by MarketsMOJO, with this rating last updated on 04 May 2026. However, the analysis and financial metrics discussed here reflect the stock's current position as of 12 July 2026, providing investors with an up-to-date view of the company’s fundamentals, returns, and market standing.
Read full news article Announcements
Compliances-Certificate under Reg. 74 (5) of SEBI (DP) Regulations 2018
13-Jul-2026 | Source : BSECertificate under Reg. 74(5) of SEBI (DP) Regulations
General Update - Disclosure Under Reg. 29(2) Of SEBI (SAST) Regulations
01-Jul-2026 | Source : BSEGeneral Update - Disclosure under Reg. 29(2) of SEBI (SAST) Regulations
General Update - Disclosure Under Regulation 7(2) Of SEBI (PIT) Regulations
01-Jul-2026 | Source : BSEDisclosure under Reg. 7(2) of SEBI (PIT) Regulations
Corporate Actions

No Upcoming Board Meetings

No Dividend history available

No Splits history available

NINtec Systems Ltd has announced 4:5 bonus issue, ex-date: 03 Aug 23

No Rights history available
Quality key factors
Valuation key factors
Technicals key factors
 Technical Indicator Scale: Bearish, Mildly Bearish, Sideways, Mildly Bullish, Bullish Turned
 Shareholding Snapshot : Mar 2026
Shareholding Compare (%holding)
Non Institution
None
Held by 0 Schemes
Held by 0 FIIs
Niraj Chhaganraj Gemawat (18.3%)
Tecthink B.v (25.44%)
23.68%
Quarterly Results Snapshot (Consolidated) - Mar'26 - YoY

YoY Growth in quarter ended Mar 2026 is 22.51% vs 18.54% in Mar 2025

YoY Growth in quarter ended Mar 2026 is 18.91% vs 29.63% in Mar 2025
Half Yearly Results Snapshot (Standalone) - Sep'25
Growth in half year ended Sep 2025 is 17.35% vs 48.05% in Sep 2024
Growth in half year ended Sep 2025 is 22.81% vs 81.10% in Sep 2024
Nine Monthly Results Snapshot (Standalone) - Dec'25
YoY Growth in nine months ended Dec 2025 is 19.27% vs 37.88% in Dec 2024
YoY Growth in nine months ended Dec 2025 is 18.84% vs 79.57% in Dec 2024
Annual Results Snapshot (Consolidated) - Mar'26
YoY Growth in year ended Mar 2026 is 21.72% vs 68.33% in Mar 2025
YoY Growth in year ended Mar 2026 is 21.62% vs 69.70% in Mar 2025
About NINtec Systems Ltd

Company Coordinates


