
Compare Vantage Knowledg with Similar Stocks
Dashboard
With a Operating Losses, the company has a Weak Long Term Fundamental Strength
- Company's ability to service its debt is weak with a poor EBIT to Interest (avg) ratio of 0.70
- The company has been able to generate a Return on Equity (avg) of 8.27% signifying low profitability per unit of shareholders funds
Flat results in Mar 26
Risky - Negative Operating Profits
Consistent Underperformance against the benchmark over the last 3 years
Stock DNA
Other Consumer Services
INR 35 Cr (Micro Cap)
296.00
151
0.00%
-0.41
0.31%
0.91
Total Returns (Price + Dividend) 
Vantage Knowledg for the last several years.
Risk Adjusted Returns v/s
Returns Beta

News
Are Vantage Knowledge Academy Ltd latest results good or bad?
Vantage Knowledge Academy Ltd's latest financial results for Q4 FY26 reveal significant operational challenges. The company reported a net profit of -₹0.60 crores, marking a stark contrast to the ₹1.06 crores profit from the same quarter last year. This shift indicates a substantial loss in profitability year-over-year. Additionally, the revenue for the quarter plummeted by 88.75% to just ₹0.09 crores, compared to ₹0.80 crores in Q4 FY25, highlighting a severe decline in sales performance. The operating margin for the quarter was recorded at -255.56%, reflecting deep operational losses, while the profit after tax (PAT) margin stood at -666.67%, suggesting a critical profitability crisis. The company's financial metrics indicate a troubling trend, as the operating profit margin has worsened from -188.75% in the previous year, underscoring escalating operational inefficiencies. Moreover, the full-year perfo...
Read full news article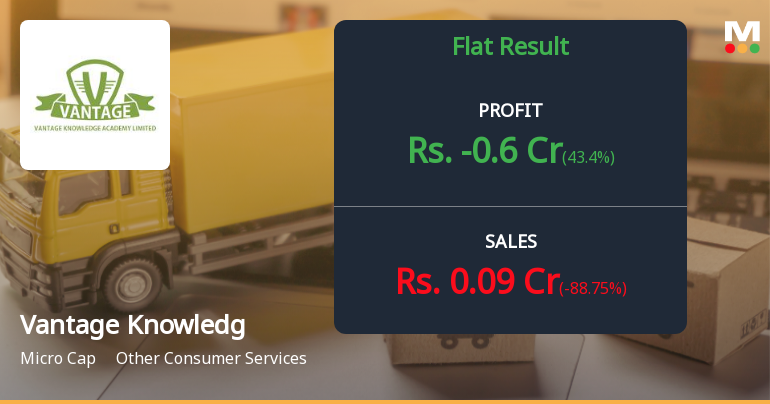
Vantage Knowledge Academy Q4 FY26: Severe Revenue Collapse Triggers Massive Loss
Vantage Knowledge Academy Ltd., a micro-cap education services provider, reported a devastating fourth quarter for FY26, posting a net loss of ₹0.60 crores against a profit of ₹1.06 crores in the same quarter last year. The catastrophic 88.75% year-on-year revenue collapse to just ₹0.09 crores has raised serious questions about the company's operational viability and business model sustainability.
Read full news article Announcements
Announcement under Regulation 30 (LODR)-Memorandum of Understanding /Agreements
10-Jun-2026 | Source : BSEThe Exchange and Investors are hereby informed that Vantage Knowledge Academy Limited (the company) had entered into Memorandum of Understanding (MOA) with Kala Institute of Management Studies and Research (KIMSR)for further growth and business development of the company in higher education sector.
Announcement under Regulation 30 (LODR)-Newspaper Publication
02-Jun-2026 | Source : BSEPlease find the attached Newspaper cuttings dated June 022026 wherein Audited Financial Results of the company for Quarter and Financial Year Ended March 312026 had been published in compliance with Regulation 47 of SEBI LODR Regulations2015.
Audited Financial Results For The Quarter And Financial Year Ended March 312026
30-May-2026 | Source : BSEPlease find the enclosed Audited Financial Results for the Quarter and Financial Year Ended March 312026 alongwith Audit Report issued by Statutory Auditor of the Company on said Audited Financial Results
Corporate Actions

No Upcoming Board Meetings

Vantage Knowledge Academy Ltd has declared 10% dividend, ex-date: 17 Jan 25

Vantage Knowledge Academy Ltd has announced 1:10 stock split, ex-date: 12 Jul 24

Vantage Knowledge Academy Ltd has announced 2:1 bonus issue, ex-date: 05 Mar 25

No Rights history available
Quality key factors
Valuation key factors
Technicals key factors
 Technical Indicator Scale: Bearish, Mildly Bearish, Sideways, Mildly Bullish, Bullish Turned
 Shareholding Snapshot : Mar 2026
Shareholding Compare (%holding)
Non Institution
None
Held by 0 Schemes
Held by 0 FIIs
Richmore Securities P Ltd (2.19%)
Sagar Portfolio Services Limited (5.93%)
77.27%
Quarterly Results Snapshot (Standalone) - Mar'26 - YoY

YoY Growth in quarter ended Mar 2026 is -88.75% vs -60.20% in Mar 2025

YoY Growth in quarter ended Mar 2026 is 43.40% vs -657.89% in Mar 2025
Half Yearly Results Snapshot (Standalone) - Sep'25
Growth in half year ended Sep 2025 is -17.37% vs 3.09% in Sep 2024
Growth in half year ended Sep 2025 is -51.18% vs 47.67% in Sep 2024
Nine Monthly Results Snapshot (Standalone) - Dec'25
YoY Growth in nine months ended Dec 2025 is -32.34% vs 16.96% in Dec 2024
YoY Growth in nine months ended Dec 2025 is -58.29% vs 21.53% in Dec 2024
Annual Results Snapshot (Standalone) - Mar'26
YoY Growth in year ended Mar 2026 is -45.27% vs -19.21% in Mar 2025
YoY Growth in year ended Mar 2026 is -82.61% vs -50.36% in Mar 2025
About Vantage Knowledge Academy Ltd

Company Coordinates


