
Compare Hiliks Technolog with Similar Stocks
Dashboard
Weak Long Term Fundamental Strength with an average Return on Equity (ROE) of 3.00%
With a growth in Net Sales of 98.26%, the company declared Very Positive results in Mar 26
With ROE of 3.2, it has a Very Expensive valuation with a 2.6 Price to Book Value
Majority shareholders : Non Institution
Market Beating performance in long term as well as near term
Stock DNA
Non Banking Financial Company (NBFC)
INR 75 Cr (Micro Cap)
86.00
21
0.00%
0.00
3.15%
2.63
Total Returns (Price + Dividend) 
Hiliks Technolog for the last several years.
Risk Adjusted Returns v/s
Returns Beta

News

Hiliks Technologies Ltd Upgraded to Hold on Technical and Financial Improvements
Hiliks Technologies Ltd, a micro-cap player in the Non Banking Financial Company (NBFC) sector, has seen its investment rating upgraded from Sell to Hold as of 22 June 2026. This change reflects a notable improvement in the company’s technical indicators, financial performance, and market returns, despite a valuation that remains very expensive relative to peers. The upgrade signals cautious optimism among investors, balancing strong momentum against stretched price multiples and modest profitability metrics.
Read full news article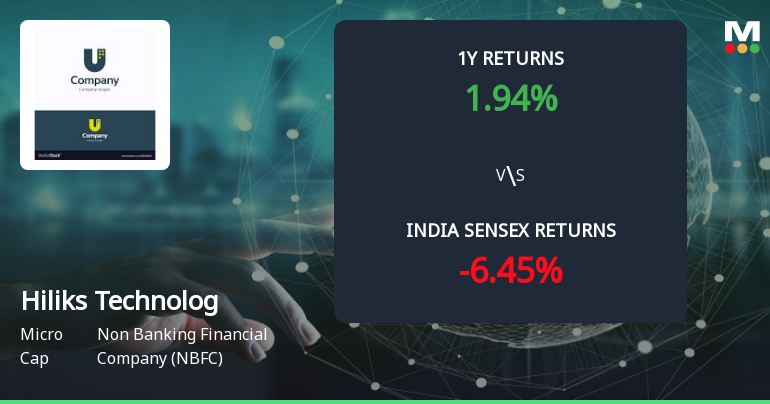
Golden Cross Forms in Hiliks Technologies Ltd — On a Day the Stock Rose Nearly 10%. What the Mixed Signals Mean
The 50-day moving average has crossed above the 200-day moving average for Hiliks Technologies Ltd, signalling a golden cross on 22 Jun 2026. Yet, the stock surged 9.99% on the day the cross formed, while some monthly technical indicators remain mildly bearish. This juxtaposition of signals invites a closer examination of whether the golden cross stands on firm ground or is contradicted by other data.
Read full news article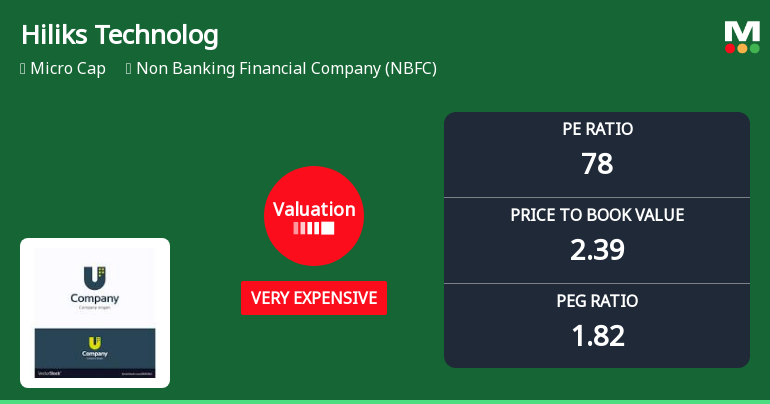
Hiliks Technologies Ltd Valuation Shifts Signal Heightened Price Risk
Hiliks Technologies Ltd, a micro-cap player in the Non Banking Financial Company (NBFC) sector, has witnessed a notable shift in its valuation parameters, moving from an already expensive rating to a very expensive classification. This change, coupled with a recent 9.97% surge in its share price to ₹59.36, invites a closer examination of its price attractiveness relative to historical levels and peer benchmarks.
Read full news article Announcements
Announcement under Regulation 30 (LODR)-Award_of_Order_Receipt_of_Order
18-Jun-2026 | Source : BSEPlease find attached Intimation regarding entering into sub contract agreement.
Revised Auditor Reports (Stand Alone And Consolidated) Along With Financial Results For The Quarter And Year Ended 31St March 2026
12-Jun-2026 | Source : BSEThis is to inform that the Company has filed the Auditor Reports (Standalone and Consolidated) for the quarter and financial year ended 31st March 2026 on 30th May 2026. It came to our notice that there was an inadvertent typographical error in the first paragraph of the said Reports wherein the word reviewed was inadvertently mentioned instead of word audited. The aforesaid error has been rectified and the revised reports along with the Financial Results are enclosed herewith for your kind consideration and records. Further except for the correction referred above there are no modifications or amendments to the Auditor Reports or Financial Results previously submitted by the Company.
Announcement under Regulation 30 (LODR)-Award_of_Order_Receipt_of_Order
11-Jun-2026 | Source : BSEThe Company has received sub contract order dated 10.06.2026 towards Signaling and Telecommunication works. Please find attached the requisite details of the order.
Corporate Actions

No Upcoming Board Meetings

No Dividend history available

No Splits history available

No Bonus history available

No Rights history available
Quality key factors
Valuation key factors
Technicals key factors
 Technical Indicator Scale: Bearish, Mildly Bearish, Sideways, Mildly Bullish, Bullish Turned
 Shareholding Snapshot : Mar 2026
Shareholding Compare (%holding)
Non Institution
None
Held by 0 Schemes
Held by 0 FIIs
Pacheli Developers Private Limited (4.65%)
Enact Technologies Private Limited (19.62%)
65.72%
Quarterly Results Snapshot (Standalone) - Mar'26 - QoQ

QoQ Growth in quarter ended Mar 2026 is 98.26% vs 111.02% in Dec 2025

QoQ Growth in quarter ended Mar 2026 is 365.38% vs -196.30% in Dec 2025
Half Yearly Results Snapshot (Standalone) - Sep'25
Growth in half year ended Sep 2025 is 81.55% vs 4,314.29% in Sep 2024
Growth in half year ended Sep 2025 is 41.38% vs 160.42% in Sep 2024
Nine Monthly Results Snapshot (Standalone) - Dec'25
YoY Growth in nine months ended Dec 2025 is 176.88% vs 5,377.78% in Dec 2024
YoY Growth in nine months ended Dec 2025 is -65.91% vs 200.00% in Dec 2024
Annual Results Snapshot (Standalone) - Mar'26
YoY Growth in year ended Mar 2026 is 323.93% vs 605.05% in Mar 2025
YoY Growth in year ended Mar 2026 is 82.61% vs 820.00% in Mar 2025
About Hiliks Technologies Ltd

Company Coordinates


