
Compare Wealth First Por with Similar Stocks
Dashboard
With ROE of 25.7, it has a Very Expensive valuation with a 6.6 Price to Book Value
- The stock is trading at a fair value compared to its peers' average historical valuations
- Over the past year, while the stock has generated a return of NA, its profits have risen by 9.6% ; the PEG ratio of the company is 2.7
Despite the size of the company, domestic mutual funds hold only 0% of the company
Stock DNA
Capital Markets
INR 982 Cr (Micro Cap)
26.00
21
1.72%
0.00
25.70%
6.57
Total Returns (Price + Dividend) 
Latest dividend: 4 per share ex-dividend date: Feb-10-2026
Risk Adjusted Returns v/s
Returns Beta

News

Wealth First Portfolio Managers Ltd Downgraded to Sell Amid Technical Weakness and Valuation Concerns
Wealth First Portfolio Managers Ltd has seen its investment rating downgraded from Hold to Sell as of 30 July 2026, driven primarily by deteriorating technical indicators and valuation pressures despite solid financial performance. The micro-cap capital markets firm’s Mojo Score has declined to 41.0, reflecting a cautious stance amid mixed signals across quality, valuation, financial trends, and technicals.
Read full news article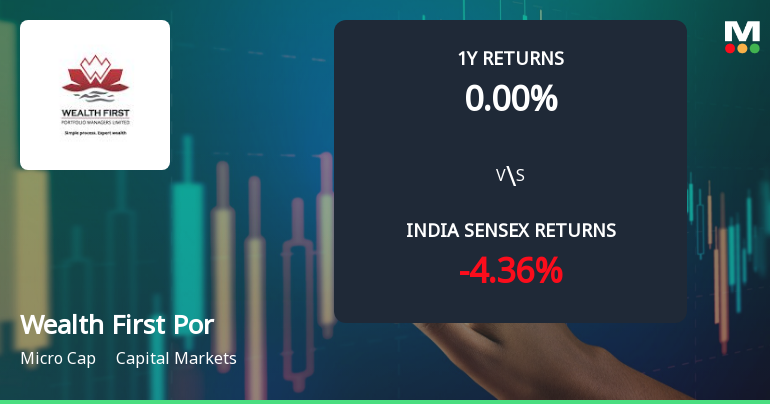
Wealth First Portfolio Managers Ltd Faces Technical Downshift Amid Market Pressure
Wealth First Portfolio Managers Ltd has experienced a notable shift in its technical momentum, moving from a mildly bullish to a mildly bearish trend as of late July 2026. This change is underscored by a combination of weakening moving averages, bearish Bollinger Bands, and a decline in price, signalling caution for investors amid broader market fluctuations.
Read full news article
Wealth First Portfolio Managers Ltd is Rated Hold
Wealth First Portfolio Managers Ltd is rated 'Hold' by MarketsMOJO, with this rating last updated on 20 July 2026. While the rating was revised on that date, the analysis and financial metrics discussed here reflect the company’s current position as of 27 July 2026.
Read full news article Announcements
Compliances-Certificate under Reg. 74 (5) of SEBI (DP) Regulations 2018
07-Jul-2026 | Source : BSECertificate under Reg. 74(5) of SEBI (DP) Regulations 2018
Announcement under Regulation 30 (LODR)-Press Release / Media Release
01-Jul-2026 | Source : BSEAnnouncement under Regulation 30 (LODR) - Press Release for Acquisition.
Announcement under Regulation 30 (LODR)-Investor Presentation
01-Jul-2026 | Source : BSEAnnouncement under Regulation 30 (LODR) - Investor Presentation
Corporate Actions

No Upcoming Board Meetings

Wealth First Portfolio Managers Ltd has declared 40% dividend, ex-date: 10 Feb 26

No Splits history available

No Bonus history available

No Rights history available
Quality key factors
Valuation key factors
Technicals key factors
 Technical Indicator Scale: Bearish, Mildly Bearish, Sideways, Mildly Bullish, Bullish Turned
 Shareholding Snapshot : Jun 2026
Shareholding Compare (%holding)
Promoters
None
Held by 0 Schemes
Held by 1 FIIs (0.0%)
Ashish Navnitlal Shah (32.16%)
Waao Partners (2.47%)
20.9%
Quarterly Results Snapshot (Consolidated) - Mar'26 - YoY

YoY Growth in quarter ended Mar 2026 is 606.44% vs -122.34% in Mar 2025
YoY Growth in quarter ended Mar 2026 is 345.22% vs -130.93% in Mar 2025
Half Yearly Results Snapshot (Consolidated) - Sep'25

Growth in half year ended Sep 2025 is 12.99% vs 62.17% in Sep 2024
Growth in half year ended Sep 2025 is -7.34% vs 55.91% in Sep 2024
Nine Monthly Results Snapshot (Consolidated) - Dec'25
YoY Growth in nine months ended Dec 2025 is -8.05% vs 41.94% in Dec 2024
YoY Growth in nine months ended Dec 2025 is -26.77% vs 33.43% in Dec 2024
Annual Results Snapshot (Consolidated) - Mar'26
YoY Growth in year ended Mar 2026 is 28.65% vs -2.15% in Mar 2025
YoY Growth in year ended Mar 2026 is 13.21% vs -19.99% in Mar 2025
About Wealth First Portfolio Managers Ltd

Company Coordinates


