
Compare Shanti Educat. with Similar Stocks
Dashboard
Poor Management Efficiency with a low ROE of 8.84%
- The company has been able to generate a Return on Equity (avg) of 8.84% signifying low profitability per unit of shareholders funds
Company has a Debt to Equity ratio (avg) of 0.06 times
Healthy long term growth as Net Sales has grown by an annual rate of 71.60% and Operating profit at 75.01%
Negative results in Mar 26
With ROE of 7.7, it has a Very Expensive valuation with a 46 Price to Book Value
Reducing Promoter Confidence
Stock DNA
Other Consumer Services
INR 3,429 Cr (Small Cap)
598.00
170
0.00%
0.06
7.69%
45.95
Total Returns (Price + Dividend) 
Shanti Educat. for the last several years.
Risk Adjusted Returns v/s
Returns Beta

News
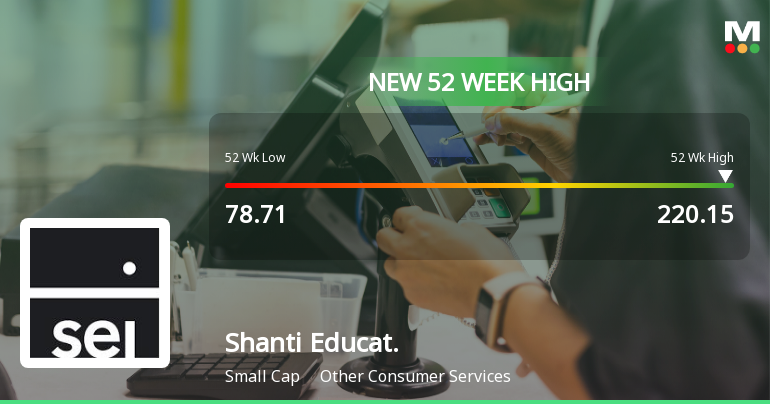
Broad-Based Technical Strength Lifts Shanti Educational Initiatives Ltd to 52-Week High of Rs 220.15
From a 52-week low of Rs 78.71 to a fresh high of Rs 220.15 on 23 Jun 2026, Shanti Educational Initiatives Ltd has surged an impressive 164.05% over the past year, vastly outperforming the Sensex’s decline of 5.80% during the same period. This remarkable price momentum is underpinned by a confluence of bullish technical indicators across multiple timeframes, signalling robust upward momentum for the small-cap stock in the Other Consumer Services sector.
Read full news article
Shanti Educational Initiatives Ltd Surges 7.05% to Day's High of Rs 220 — Outperforms Sector by 3.53 Percentage Points
The Sensex edged up 0.46% on 22 Jun 2026, but Shanti Educational Initiatives Ltd outpaced the broader market with a 7.05% gain, reaching an intraday high of Rs 220. This 3.53 percentage-point outperformance over its sector peers in Other Consumer Services highlights a distinctly stock-specific rally rather than a market-wide lift.
Read full news article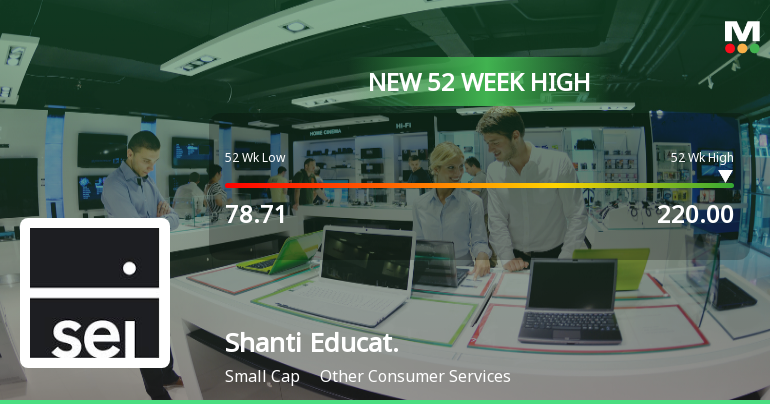
Broad-Based Technical Strength Lifts Shanti Educational Initiatives Ltd to 52-Week High of Rs 220
Surging past its previous peak, Shanti Educational Initiatives Ltd touched a fresh 52-week high of Rs 220 on 22 Jun 2026, marking a remarkable 167.22% gain over the past year. This milestone comes amid a backdrop of strong technical momentum and a broader market rally, underscoring the stock’s robust price action and investor enthusiasm.
Read full news article Announcements
Announcement under Regulation 30 (LODR)-Change in Registered Office Address
03-Jun-2026 | Source : BSEIntimation under Regulation 30 SEBI (LODR) 2015 regarding receipt of Order from RD regarding Shifting of Registered Office
Compliances-Reg.24(A)-Annual Secretarial Compliance
29-May-2026 | Source : BSEAnnual Secretarial Compliance Report for the Year ended March 31 2026.
Announcement under Regulation 30 (LODR)-Newspaper Publication
25-May-2026 | Source : BSENewspaper Publication
Corporate Actions

No Upcoming Board Meetings

No Dividend history available

Shanti Educational Initiatives Ltd has announced 1:10 stock split, ex-date: 21 Jul 22

No Bonus history available

No Rights history available
Quality key factors
Valuation key factors
Technicals key factors
 Technical Indicator Scale: Bearish, Mildly Bearish, Sideways, Mildly Bullish, Bullish Turned
 Shareholding Snapshot : Mar 2026
Shareholding Compare (%holding)
Promoters
None
Held by 0 Schemes
Held by 24 FIIs (24.64%)
Vedprakash Devkinandan Chiripal (5.28%)
Legends Global Opportunities (singapore) Pte. Ltd. (3.9%)
13.06%
Quarterly Results Snapshot (Consolidated) - Mar'26 - YoY

YoY Growth in quarter ended Mar 2026 is 22.98% vs 549.66% in Mar 2025

YoY Growth in quarter ended Mar 2026 is 308.51% vs 56.88% in Mar 2025
Half Yearly Results Snapshot (Consolidated) - Sep'25
Growth in half year ended Sep 2025 is 35.61% vs 51.23% in Sep 2024
Growth in half year ended Sep 2025 is -1.25% vs 22.32% in Sep 2024
Nine Monthly Results Snapshot (Consolidated) - Dec'25
YoY Growth in nine months ended Dec 2025 is -19.28% vs 148.61% in Dec 2024
YoY Growth in nine months ended Dec 2025 is -34.88% vs 59.07% in Dec 2024
Annual Results Snapshot (Consolidated) - Mar'26
YoY Growth in year ended Mar 2026 is -5.78% vs 209.66% in Mar 2025
YoY Growth in year ended Mar 2026 is -16.57% vs 93.42% in Mar 2025
About Shanti Educational Initiatives Ltd

Company Coordinates


