
Compare East WestFreight with Similar Stocks
Dashboard
Weak Long Term Fundamental Strength with a -43.93% CAGR growth in Operating Profits over the last 5 years
- Low ability to service debt as the company has a high Debt to EBITDA ratio of 38.30 times
- The company has been able to generate a Return on Equity (avg) of 3.12% signifying low profitability per unit of shareholders funds
The company has declared Negative results for the last 5 consecutive quarters
Below par performance in long term as well as near term
Stock DNA
Transport Services
INR 32 Cr (Micro Cap)
NA (Loss Making)
33
0.00%
1.06
-6.32%
0.51
Total Returns (Price + Dividend) 
Latest dividend: 0 per share ex-dividend date: Dec-17-2020
Risk Adjusted Returns v/s
Returns Beta

News

East West Freight Carriers Ltd is Rated Strong Sell
East West Freight Carriers Ltd is rated Strong Sell by MarketsMOJO. This rating was last updated on 02 June 2025, but the analysis below reflects the stock’s current position as of 03 July 2026, incorporating the latest fundamentals, returns, and financial metrics available today.
Read full news article
East West Freight Carriers Ltd is Rated Strong Sell
East West Freight Carriers Ltd is rated Strong Sell by MarketsMOJO. This rating was last updated on 02 June 2025. However, the analysis and financial metrics discussed below reflect the stock’s current position as of 19 June 2026, providing investors with an up-to-date view of the company’s fundamentals, returns, and market performance.
Read full news article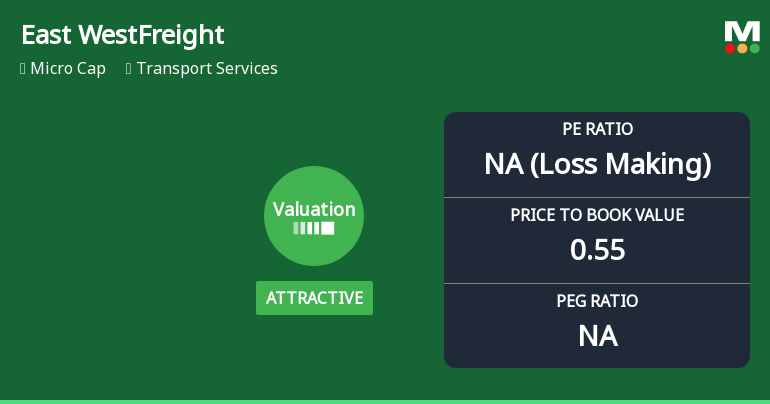
East West Freight Carriers Ltd Valuation Shifts Signal Price Attractiveness Amid Sector Challenges
East West Freight Carriers Ltd, a micro-cap player in the transport services sector, has seen a notable shift in its valuation parameters, moving from a fair to an attractive valuation grade despite enduring significant share price underperformance relative to the broader market. This article analyses the recent changes in key valuation metrics, compares them with industry peers, and assesses the implications for investors amid the company’s challenging financial backdrop.
Read full news article Announcements
Compliances-Certificate under Reg. 74 (5) of SEBI (DP) Regulations 2018
07-Jul-2026 | Source : BSEAs per attachment
Closure of Trading Window
27-Jun-2026 | Source : BSETrading window closure intimation.
Announcement under Regulation 30 (LODR)-Newspaper Publication
16-Jun-2026 | Source : BSEPublication of Newspaper advertisement for the attention of shareholders w.r.t transfer of unpaid and unclaimed Dividend and share to IEPF
Corporate Actions

No Upcoming Board Meetings


East West Freight Carriers Ltd has announced 2:10 stock split, ex-date: 30 Mar 21

East West Freight Carriers Ltd has announced 1:4 bonus issue, ex-date: 30 Mar 21

No Rights history available
Quality key factors
Valuation key factors
Technicals key factors
 Technical Indicator Scale: Bearish, Mildly Bearish, Sideways, Mildly Bullish, Bullish Turned
 Shareholding Snapshot : Jun 2026
Shareholding Compare (%holding)
Promoters
None
Held by 0 Schemes
Held by 0 FIIs
Mohammad Shafi (38.72%)
Gautam Anand (2.37%)
32.0%
Quarterly Results Snapshot (Consolidated) - Mar'26 - QoQ

QoQ Growth in quarter ended Mar 2026 is -2.81% vs -17.36% in Dec 2025
QoQ Growth in quarter ended Mar 2026 is 117.02% vs -38.24% in Dec 2025
Half Yearly Results Snapshot (Consolidated) - Sep'25

Growth in half year ended Sep 2025 is -30.58% vs 63.72% in Sep 2024
Growth in half year ended Sep 2025 is -731.25% vs 220.00% in Sep 2024
Nine Monthly Results Snapshot (Consolidated) - Dec'25
YoY Growth in nine months ended Dec 2025 is -30.52% vs 61.34% in Dec 2024
YoY Growth in nine months ended Dec 2025 is -550.52% vs 193.94% in Dec 2024
Annual Results Snapshot (Consolidated) - Mar'26
YoY Growth in year ended Mar 2026 is -29.33% vs 36.89% in Mar 2025
YoY Growth in year ended Mar 2026 is -408.53% vs -79.75% in Mar 2025
About East West Freight Carriers Ltd

Company Coordinates


