
Compare Dilip Buildcon with Similar Stocks
Dashboard
Weak Long Term Fundamental Strength with a -2.73% CAGR growth in Operating Profits over the last 5 years
- Low ability to service debt as the company has a high Debt to EBITDA ratio of 4.55 times
- The company has been able to generate a Return on Equity (avg) of 3.23% signifying low profitability per unit of shareholders funds
Negative results in Mar 26
Falling Participation by Institutional Investors
Stock DNA
Construction
INR 7,180 Cr (Small Cap)
15.00
46
0.23%
1.12
6.97%
1.05
Total Returns (Price + Dividend) 
Latest dividend: 1 per share ex-dividend date: Sep-08-2025
Risk Adjusted Returns v/s
Returns Beta

News

Dilip Buildcon Ltd. Technical Momentum Shifts Amid Mixed Market Signals
Dilip Buildcon Ltd., a small-cap player in the construction sector, has experienced a notable shift in its technical momentum, moving from a sideways trend to a mildly bearish stance. Despite some bullish weekly indicators, monthly signals remain cautious, reflecting a complex technical landscape that investors must carefully analyse amid recent price movements and sector dynamics.
Read full news article
Dilip Buildcon Ltd. is Rated Strong Sell
Dilip Buildcon Ltd. is rated Strong Sell by MarketsMOJO, with this rating last updated on 14 May 2026. However, the analysis and financial metrics discussed here reflect the company’s current position as of 30 June 2026, providing investors with the latest insights into its performance and outlook.
Read full news article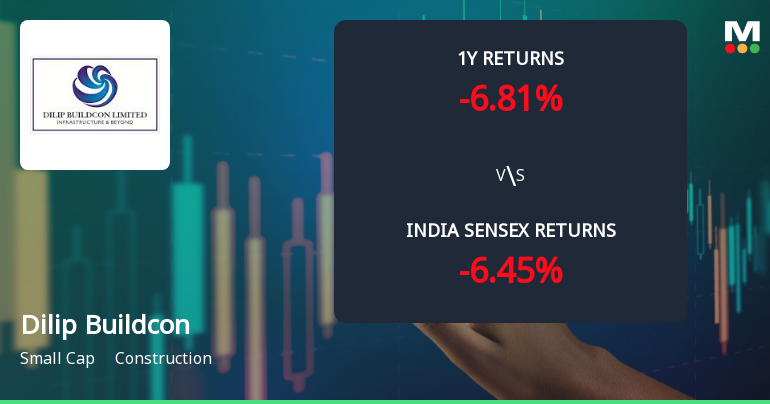
Dilip Buildcon Ltd. Technical Momentum Shifts Amid Mixed Market Signals
Dilip Buildcon Ltd., a small-cap player in the construction sector, has exhibited a notable shift in its technical momentum, moving from a mildly bearish stance to a sideways trend. Despite a recent 3.40% gain in daily price, the stock’s technical indicators present a complex picture, with mixed signals from MACD, RSI, moving averages, and other momentum oscillators. This analysis delves into the evolving technical landscape of Dilip Buildcon, contextualising its price action against broader market movements and sectoral trends.
Read full news article Announcements
Closure of Trading Window
26-Jun-2026 | Source : BSEIn accordance with the provisions of the Securities and Exchange Board of India (Prohibition of Insider Trading) Regulations 2015 and the Companys Code of Conduct for Insider Trading as amended from time to time. We would like to inform you that the trading window for dealing in the securities of the Company for all insiders connected persons designated persons and their immediate relatives fiduciaries and intermediaries shall be closed from 01st July 2026 till 48 hours after the declaration of financial results of the Company for the quarter ended June 30 2026.
Announcement under Regulation 30 (LODR)-Analyst / Investor Meet - Intimation
10-Jun-2026 | Source : BSEIntimation about attending an investors conference on June 16 2026 Please refer the attachment for more details
Compliances-Reg.24(A)-Annual Secretarial Compliance
23-May-2026 | Source : BSEPursuant to Regulation 24(A) of the SEBI (Listing Obligations and Disclosure requirements) Regulations 2015 please find enclosed herewith the Annual Secretarial Compliance Report of Dilip Buildcon Limited issued by M/s Piyush Bindal & Associates Company Secretaries Bhopal for the financial year ended on March 31 2026
Corporate Actions

No Upcoming Board Meetings

Dilip Buildcon Ltd. has declared 10% dividend, ex-date: 08 Sep 25

No Splits history available

No Bonus history available

No Rights history available
Quality key factors
Valuation key factors
Technicals key factors
 Technical Indicator Scale: Bearish, Mildly Bearish, Sideways, Mildly Bullish, Bullish Turned
 Shareholding Snapshot : Mar 2026
Shareholding Compare (%holding)
Promoters
14.1626
Held by 6 Schemes (2.07%)
Held by 62 FIIs (1.97%)
Dilip Suryavanshi (33.92%)
None
11.88%
Quarterly Results Snapshot (Consolidated) - Mar'26 - YoY

YoY Growth in quarter ended Mar 2026 is -25.72% vs -8.01% in Mar 2025
YoY Growth in quarter ended Mar 2026 is -63.68% vs 3,099.06% in Mar 2025
Half Yearly Results Snapshot (Consolidated) - Sep'25
Growth in half year ended Sep 2025 is -18.75% vs -3.01% in Sep 2024
Growth in half year ended Sep 2025 is 15.72% vs 336.26% in Sep 2024
Nine Monthly Results Snapshot (Consolidated) - Dec'25
YoY Growth in nine months ended Dec 2025 is -18.34% vs -5.33% in Dec 2024

YoY Growth in nine months ended Dec 2025 is 163.90% vs 149.08% in Dec 2024
Annual Results Snapshot (Consolidated) - Mar'26
YoY Growth in year ended Mar 2026 is -20.61% vs -5.79% in Mar 2025
YoY Growth in year ended Mar 2026 is 103.23% vs 230.27% in Mar 2025
About Dilip Buildcon Ltd.

Company Coordinates


