
Compare Dhatre Udyog with Similar Stocks
Dashboard
With a Operating Losses, the company has a Weak Long Term Fundamental Strength
- Company's ability to service its debt is weak with a poor EBIT to Interest (avg) ratio of 0.82
- The company has been able to generate a Return on Equity (avg) of 5.85% signifying low profitability per unit of shareholders funds
Negative results in Mar 26
Risky - Negative EBITDA
Underperformed the market in the last 1 year
Stock DNA
Iron & Steel Products
INR 51 Cr (Micro Cap)
NA (Loss Making)
26
0.00%
-0.04
-3.81%
1.05
Total Returns (Price + Dividend) 
Dhatre Udyog for the last several years.
Risk Adjusted Returns v/s
Returns Beta

News
Dhatre Udyog Ltd is Rated Strong Sell
Dhatre Udyog Ltd is rated Strong Sell by MarketsMOJO. This rating was last updated on 16 July 2024. However, the analysis and financial metrics discussed below reflect the company’s current position as of 18 June 2026, providing investors with an up-to-date view of the stock’s fundamentals, returns, and overall outlook.
Read full news article
Dhatre Udyog Ltd is Rated Strong Sell
Dhatre Udyog Ltd is rated Strong Sell by MarketsMOJO, with this rating last updated on 16 July 2024. However, the analysis and financial metrics discussed here reflect the company’s current position as of 04 June 2026, providing investors with an up-to-date view of its fundamentals, returns, and overall market standing.
Read full news article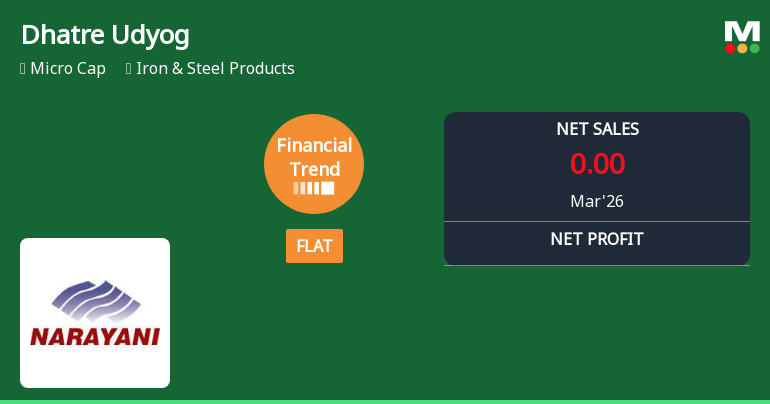
Dhatre Udyog Ltd Reports Flat Quarterly Performance Amid Margin Pressures
Dhatre Udyog Ltd, a micro-cap player in the Iron & Steel Products sector, has reported a flat financial performance for the quarter ended March 2026, signalling a pause in its recent downward trend. Despite an improvement in its financial trend score from -11 to -3 over the past three months, the company continues to face significant profitability challenges, with its profit before tax (PBT) plunging sharply. This latest quarter’s results come amid a broader market context where the stock has underperformed the Sensex across multiple time frames.
Read full news article Announcements
Announcement under Regulation 30 (LODR)-Newspaper Publication
30-May-2026 | Source : BSENewspaper Publication for the Financial Results for the quarter ended 31st March2026
Board Meeting Outcome for Outcome Of Board Meeting
29-May-2026 | Source : BSEOutcome of Board Meeting dated 29th May2026
FINANCIAL RESULT FOR THE QUARTER ENDED 31ST MARCH 2026
29-May-2026 | Source : BSEFINANCIAL RESULT FOR THE QUARTER ENDED 31ST MARCH 2026
Corporate Actions

No Upcoming Board Meetings

No Dividend history available

Dhatre Udyog Ltd has announced 1:10 stock split, ex-date: 28 Mar 24

No Bonus history available

No Rights history available
Quality key factors
Valuation key factors
Technicals key factors
 Technical Indicator Scale: Bearish, Mildly Bearish, Sideways, Mildly Bullish, Bullish Turned
 Shareholding Snapshot : Mar 2026
Shareholding Compare (%holding)
Promoters
None
Held by 0 Schemes
Held by 0 FIIs
Sumit Kumar Agarwal Huf (13.93%)
None
35.58%
Quarterly Results Snapshot (Standalone) - Mar'26 - YoY

YoY Growth in quarter ended Mar 2026 is -100.00% vs -76.06% in Mar 2025

YoY Growth in quarter ended Mar 2026 is -76.47% vs -90.66% in Mar 2025
Half Yearly Results Snapshot (Consolidated) - Sep'25
Growth in half year ended Sep 2025 is -89.53% vs 9.84% in Sep 2024
Growth in half year ended Sep 2025 is -264.58% vs -75.51% in Sep 2024
Nine Monthly Results Snapshot (Consolidated) - Dec'25
YoY Growth in nine months ended Dec 2025 is -92.79% vs -5.28% in Dec 2024
YoY Growth in nine months ended Dec 2025 is -239.71% vs -81.96% in Dec 2024
Annual Results Snapshot (Standalone) - Mar'26
YoY Growth in year ended Mar 2026 is -93.68% vs -30.55% in Mar 2025
YoY Growth in year ended Mar 2026 is -207.06% vs -84.79% in Mar 2025
About Dhatre Udyog Ltd

Company Coordinates


