
Compare HPL Electric with Similar Stocks
Stock DNA
Other Electrical Equipment
INR 2,427 Cr (Small Cap)
26.00
61
0.26%
0.67
9.51%
2.43
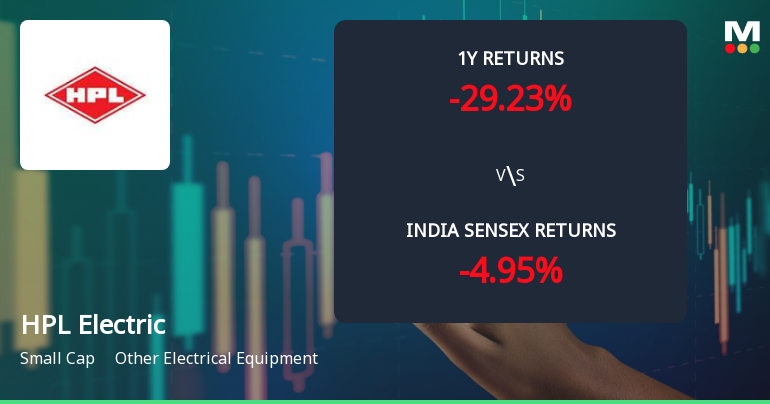
Total Returns (Price + Dividend) 
Latest dividend: 0.9968470835522859 per share ex-dividend date: Sep-22-2025
Risk Adjusted Returns v/s
Returns Beta

News
HPL Electric & Power Ltd Technical Momentum Shifts Amid Mixed Market Signals
HPL Electric & Power Ltd, a small-cap player in the Other Electrical Equipment sector, has experienced a notable shift in its technical momentum, moving from a mildly bearish stance to a sideways trend. Despite a recent downgrade in its Mojo Grade from Hold to Sell, the stock exhibits a complex interplay of bullish and bearish signals across key technical indicators, reflecting a nuanced outlook for investors.
Read full news article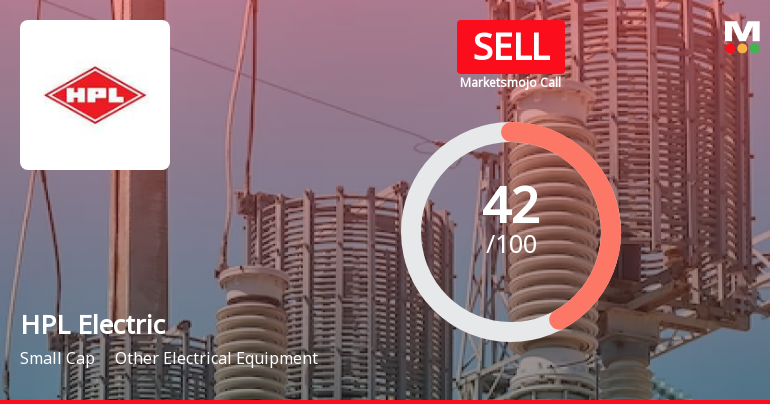
HPL Electric & Power Ltd is Rated Sell
HPL Electric & Power Ltd is rated Sell by MarketsMOJO. This rating was last updated on 13 May 2026, reflecting a reassessment of the stock’s outlook. However, all fundamentals, returns, and financial metrics discussed here are current as of 18 June 2026, providing investors with the latest perspective on the company’s position in the market.
Read full news article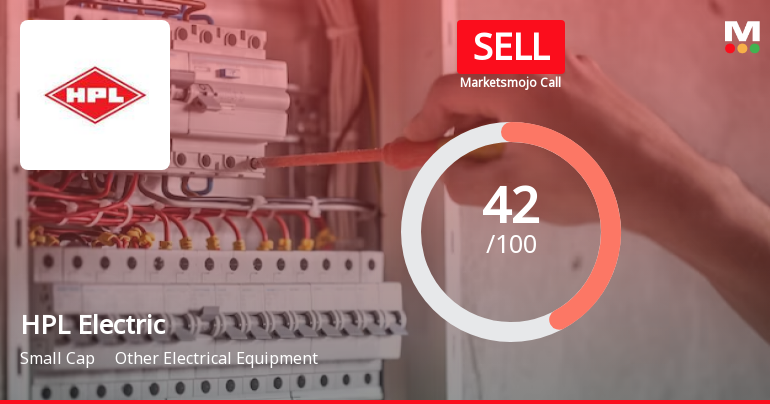
HPL Electric & Power Ltd is Rated Sell
HPL Electric & Power Ltd is rated 'Sell' by MarketsMOJO, with this rating last updated on 13 May 2026. However, the analysis and financial metrics presented here reflect the stock's current position as of 08 June 2026, providing investors with an up-to-date view of the company’s fundamentals, returns, and market performance.
Read full news article Announcements
Closure of Trading Window
19-Jun-2026 | Source : BSEClosure of Trading Window
Announcement under Regulation 30 (LODR)-Analyst / Investor Meet - Outcome
17-Jun-2026 | Source : BSEAnalyst / Investor Meet Outcome - Audio Recording
Announcement under Regulation 30 (LODR)-Analyst / Investor Meet - Intimation
12-Jun-2026 | Source : BSEAnalyst / Investor Meet
Corporate Actions

No Upcoming Board Meetings

HPL Electric & Power Ltd has declared 10% dividend, ex-date: 22 Sep 25

No Splits history available

No Bonus history available

No Rights history available
Quality key factors
Valuation key factors
Technicals key factors
 Technical Indicator Scale: Bearish, Mildly Bearish, Sideways, Mildly Bullish, Bullish Turned
 Shareholding Snapshot : Mar 2026
Shareholding Compare (%holding)
Promoters
2.4187
Held by 0 Schemes
Held by 32 FIIs (0.51%)
Hpl India Limited (27.33%)
None
23.25%
Quarterly Results Snapshot (Consolidated) - Mar'26 - YoY

YoY Growth in quarter ended Mar 2026 is 5.51% vs 16.14% in Mar 2025
YoY Growth in quarter ended Mar 2026 is -16.91% vs 170.90% in Mar 2025
Half Yearly Results Snapshot (Consolidated) - Sep'25
Growth in half year ended Sep 2025 is 0.28% vs 21.46% in Sep 2024
Growth in half year ended Sep 2025 is 5.58% vs 115.12% in Sep 2024
Nine Monthly Results Snapshot (Consolidated) - Dec'25
YoY Growth in nine months ended Dec 2025 is 6.93% vs 16.49% in Dec 2024
YoY Growth in nine months ended Dec 2025 is 6.22% vs 89.65% in Dec 2024
Annual Results Snapshot (Consolidated) - Mar'26
YoY Growth in year ended Mar 2026 is 6.52% vs 16.39% in Mar 2025
YoY Growth in year ended Mar 2026 is -2.94% vs 115.27% in Mar 2025
About HPL Electric & Power Ltd

Company Coordinates


