
Compare Viram Suvarn with Similar Stocks
Dashboard
The company is Net-Debt Free
Healthy long term growth as Operating profit has grown by an annual rate 44.69%
The company has declared Positive results for the last 3 consecutive quarters
With ROE of 11.9, it has a Attractive valuation with a 1.8 Price to Book Value
Rising Promoter Confidence
Market Beating Performance
Stock DNA
Gems, Jewellery And Watches
INR 114 Cr (Micro Cap)
15.00
52
0.00%
-0.26
11.91%
1.80
Total Returns (Price + Dividend) 
Latest dividend: 0.04 per share ex-dividend date: Feb-21-2025
Risk Adjusted Returns v/s
Returns Beta

News

Viram Suvarn Ltd is Rated Hold
Viram Suvarn Ltd is rated 'Hold' by MarketsMOJO, with this rating last updated on 09 Mar 2026. However, the analysis and financial metrics discussed here reflect the stock's current position as of 19 July 2026, providing investors with an up-to-date view of the company’s fundamentals, returns, and market performance.
Read full news article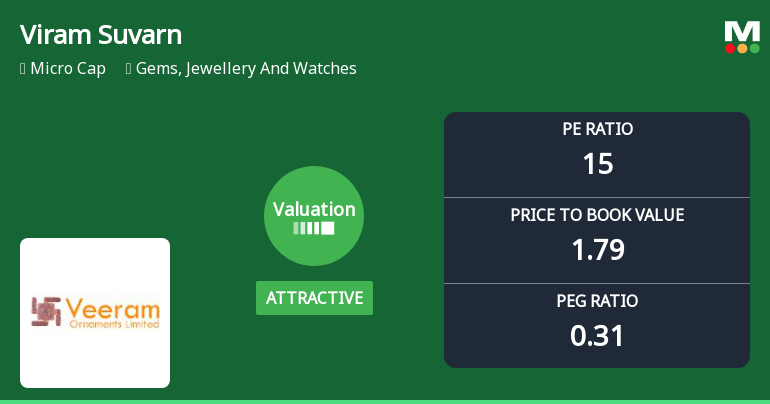
Viram Suvarn Ltd Valuation Improves to Attractive Amid Strong Returns
Viram Suvarn Ltd has witnessed a notable shift in its valuation parameters, moving from a very attractive to an attractive grade, reflecting improved price attractiveness relative to its historical averages and peer group within the gems, jewellery and watches sector. This upgrade accompanies a steady performance in key financial metrics and a positive return profile compared to the broader market.
Read full news article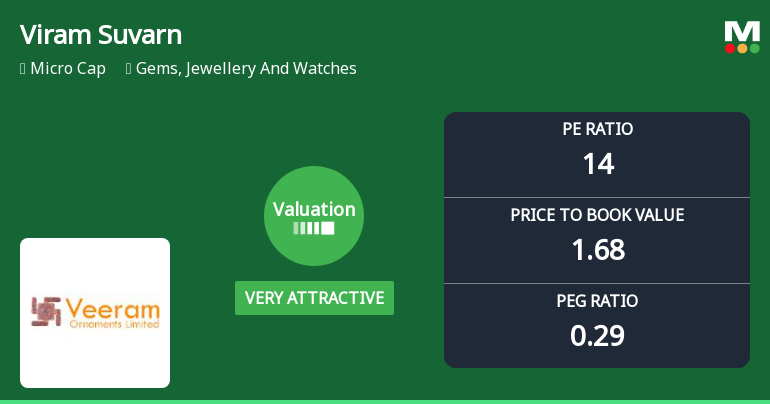
Viram Suvarn Ltd Valuation Shifts Signal Renewed Price Attractiveness
Viram Suvarn Ltd, a micro-cap player in the Gems, Jewellery and Watches sector, has witnessed a significant shift in its valuation parameters, moving from an attractive to a very attractive rating. Despite a recent sharp decline in share price, the company’s improved price-to-earnings (P/E) and price-to-book value (P/BV) ratios relative to its historical and peer averages suggest a compelling entry point for investors seeking value in a volatile market environment.
Read full news article Announcements
Closure of Trading Window
24-Jun-2026 | Source : BSEIntimation of closure of Trading window with effect from 1st July 2026 for the purpose of consideration and approval of the unaudited Financial Statements for the quarter ending June 30th 2026.
STATEMENT OF DEVIATION OR VARIATION IN UTILIZATION OF FUNDS RAISED
29-May-2026 | Source : BSEStatement on Deviation or Variation of funds- we hereby confirm that during the quarter ended 31st March 2026 there is no deviation or variation in the utilization of Proceeds of the Rights issue from the object stated inthe Letter of offer dated 5th January 2026.
Compliances-Reg.24(A)-Annual Secretarial Compliance
28-May-2026 | Source : BSEAnnual Secretarial Compliance Report for Financial Year ended 31st March 2026
Corporate Actions

No Upcoming Board Meetings

Viram Suvarn Ltd has declared 2% dividend, ex-date: 21 Feb 25

Viram Suvarn Ltd has announced 2:10 stock split, ex-date: 18 Apr 22

Viram Suvarn Ltd has announced 1:2 bonus issue, ex-date: 14 Oct 22

Viram Suvarn Ltd has announced 1:2 rights issue, ex-date: 09 Jan 26
Quality key factors
Valuation key factors
Technicals key factors
 Technical Indicator Scale: Bearish, Mildly Bearish, Sideways, Mildly Bullish, Bullish Turned
 Shareholding Snapshot : Mar 2026
Shareholding Compare (%holding)
Promoters
None
Held by 0 Schemes
Held by 0 FIIs
Veeram Vendors Private Limited (17.77%)
Mohta Sarita (5.72%)
28.47%
Quarterly Results Snapshot (Standalone) - Mar'26 - YoY

YoY Growth in quarter ended Mar 2026 is -18.78% vs 13.91% in Mar 2025

YoY Growth in quarter ended Mar 2026 is 43.30% vs -1.02% in Mar 2025
Half Yearly Results Snapshot (Standalone) - Sep'25
Growth in half year ended Sep 2025 is -12.17% vs 69.28% in Sep 2024
Growth in half year ended Sep 2025 is 75.00% vs 62.26% in Sep 2024
Nine Monthly Results Snapshot (Standalone) - Dec'25
YoY Growth in nine months ended Dec 2025 is 12.75% vs 25.83% in Dec 2024
YoY Growth in nine months ended Dec 2025 is 153.69% vs 63.76% in Dec 2024
Annual Results Snapshot (Standalone) - Mar'26
YoY Growth in year ended Mar 2026 is -7.10% vs 36.99% in Mar 2025
YoY Growth in year ended Mar 2026 is 122.29% vs 38.62% in Mar 2025
About Viram Suvarn Ltd

Company Coordinates


