
Compare Parmax Pharma with Similar Stocks
Dashboard
With a Negative Book Value, the company has a Weak Long Term Fundamental Strength
- Poor long term growth as Net Sales has grown by an annual rate of -14.30% and Operating profit at 6.65% over the last 5 years
- Company's ability to service its debt is weak with a poor EBIT to Interest (avg) ratio of 0.66
The company has declared Negative results for the last 4 consecutive quarters
Risky - Negative EBITDA
Stock DNA
Pharmaceuticals & Biotechnology
INR 34 Cr (Micro Cap)
NA (Loss Making)
36
0.00%
-1.77
67.48%
-5.57
Total Returns (Price + Dividend) 
Parmax Pharma for the last several years.
Risk Adjusted Returns v/s
Returns Beta

News

Broad-Based Technical Strength Lifts Parmax Pharma Ltd to 52-Week High of Rs 93.3
With a remarkable 65.13% gain over the past 21 trading sessions, Parmax Pharma Ltd surged to a fresh 52-week and all-time high of Rs 93.3 on 13 Jul 2026, outpacing its sector and demonstrating robust price momentum amid a mixed broader market backdrop.
Read full news article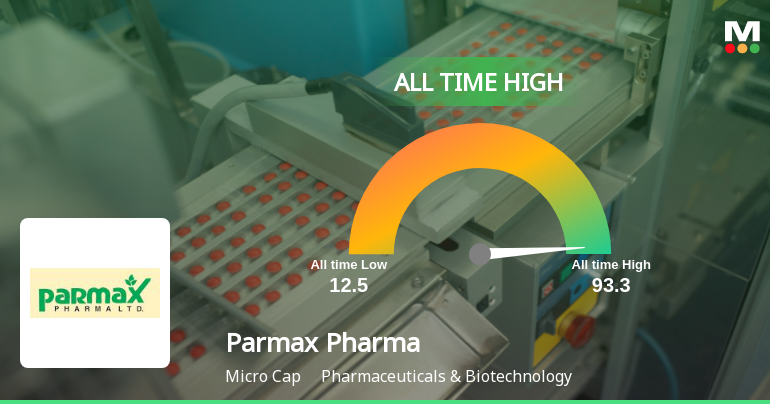
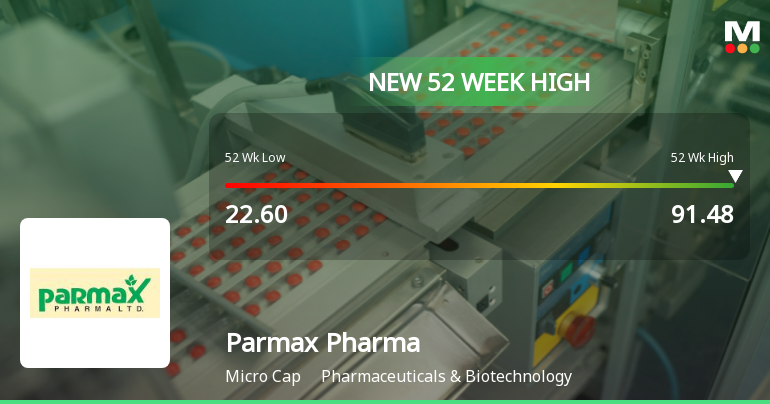
Broad-Based Technical Strength Lifts Parmax Pharma Ltd to 52-Week High of Rs 91.48
Surging to a fresh 52-week and all-time high of Rs 91.48 on 10 Jul 2026, Parmax Pharma Ltd has demonstrated remarkable price momentum, rallying over 70% in the past 21 trading sessions. This milestone caps a year of exceptional performance, with the stock more than quadrupling from its 52-week low of Rs 22.60, even as the broader Sensex declined by 6.86% over the same period.
Read full news article Announcements
Shareholder Meeting / Postal Ballot-Scrutinizers Report
03-Jul-2026 | Source : BSEScrutinizer report along with result of Evoting
Announcement under Regulation 30 (LODR)-Amendments to Memorandum & Articles of Association
02-Jul-2026 | Source : BSEAmendments to Memorandum Of Association and Articles of Association of the Company
Shareholder Meeting / Postal Ballot-Outcome of EGM
02-Jul-2026 | Source : BSEProceeding of 2nd Extra Ordinary General Meeting of the Company
Corporate Actions

No Upcoming Board Meetings

No Dividend history available

No Splits history available

No Bonus history available

No Rights history available
Quality key factors
Valuation key factors
Technicals key factors
 Technical Indicator Scale: Bearish, Mildly Bearish, Sideways, Mildly Bullish, Bullish Turned
 Shareholding Snapshot : Mar 2026
Shareholding Compare (%holding)
Non Institution
None
Held by 0 Schemes
Held by 0 FIIs
Alkesh Mahasukhlal Gopani (17.92%)
Gosalia Meena Alkesh (12.69%)
63.1%
Quarterly Results Snapshot (Standalone) - Mar'26 - YoY

YoY Growth in quarter ended Mar 2026 is -31.47% vs 13.38% in Mar 2025

YoY Growth in quarter ended Mar 2026 is 61.07% vs -2.76% in Mar 2025
Half Yearly Results Snapshot (Standalone) - Sep'25
Growth in half year ended Sep 2025 is -73.84% vs 212.43% in Sep 2024
Growth in half year ended Sep 2025 is -1,320.00% vs 92.16% in Sep 2024
Nine Monthly Results Snapshot (Standalone) - Dec'25
YoY Growth in nine months ended Dec 2025 is -62.34% vs 243.68% in Dec 2024
YoY Growth in nine months ended Dec 2025 is -505.08% vs 86.28% in Dec 2024
Annual Results Snapshot (Standalone) - Mar'26
YoY Growth in year ended Mar 2026 is -57.06% vs 155.20% in Mar 2025
YoY Growth in year ended Mar 2026 is -99.04% vs 63.65% in Mar 2025
About Parmax Pharma Ltd

Company Coordinates


