
Compare Chemcrux Enterp. with Similar Stocks
Dashboard
Strong ability to service debt as the company has a low Debt to EBITDA ratio of 3.09 times
Poor long term growth as Operating profit has grown by an annual rate -23.61% of over the last 5 years
With a growth in Net Profit of 780.95%, the company declared Very Positive results in Mar 26
With ROCE of 6.9, it has a Attractive valuation with a 1.6 Enterprise value to Capital Employed
Majority shareholders : Promoters
Consistent Underperformance against the benchmark over the last 3 years
Stock DNA
Specialty Chemicals
INR 136 Cr (Micro Cap)
36.00
43
1.10%
0.21
4.85%
1.75
Total Returns (Price + Dividend) 
Latest dividend: 1 per share ex-dividend date: Sep-17-2025
Risk Adjusted Returns v/s
Returns Beta

News
Chemcrux Enterprises Ltd is Rated Hold
Chemcrux Enterprises Ltd is rated 'Hold' by MarketsMOJO, with this rating last updated on 14 May 2026. However, the analysis and financial metrics discussed here reflect the stock's current position as of 15 June 2026, providing investors with an up-to-date view of the company’s fundamentals, returns, and market performance.
Read full news article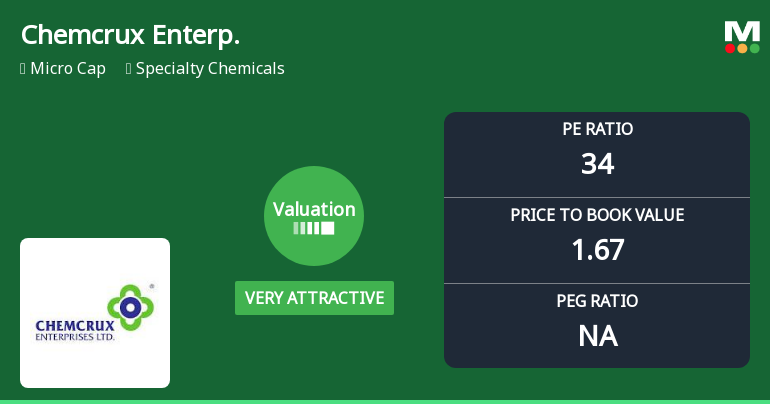
Chemcrux Enterprises Ltd: Valuation Shifts Signal Renewed Price Attractiveness Amid Market Challenges
Chemcrux Enterprises Ltd, a micro-cap player in the specialty chemicals sector, has witnessed a significant shift in its valuation parameters, moving from an 'attractive' to a 'very attractive' rating. This change reflects a notable improvement in price metrics such as the price-to-earnings (P/E) and price-to-book value (P/BV) ratios, positioning the stock as a more compelling option relative to its historical averages and peer group. Despite recent share price declines, the valuation reset invites a closer examination of the company’s fundamentals and market context.
Read full news article
Chemcrux Enterprises Ltd is Rated Hold
Chemcrux Enterprises Ltd is rated 'Hold' by MarketsMOJO, with this rating last updated on 14 May 2026. However, the analysis and financial metrics discussed here reflect the stock's current position as of 01 June 2026, providing investors with an up-to-date view of the company’s performance and outlook.
Read full news article Announcements
Compliances-Reg.24(A)-Annual Secretarial Compliance
25-May-2026 | Source : BSEAnnual Secretarial Compliance Report for the year ended 31st March 2026
Announcement under Regulation 30 (LODR)-Newspaper Publication
15-May-2026 | Source : BSENewspaper Publication of Standalone and Consolidated Audited Financial Results for the quarter and year ended 31st March 2026.
Intimation Of Grant Of Stock Options Under Chemcrux Enterprises Employee Stock Option Scheme 2025 (ESOP 2025 / Scheme) - ESOP Grant 1 - 2026
14-May-2026 | Source : BSEThe NRC has granted 107700 stock options to eligible employees pursuant to ESOP 2025/ Scheme. The grant date for ESOP Grant 1 - 2026 will be 15th May 2026.
Corporate Actions

No Upcoming Board Meetings

Chemcrux Enterprises Ltd has declared 10% dividend, ex-date: 17 Sep 25

No Splits history available

Chemcrux Enterprises Ltd has announced 2:1 bonus issue, ex-date: 06 Sep 21

No Rights history available
Quality key factors
Valuation key factors
Technicals key factors
 Technical Indicator Scale: Bearish, Mildly Bearish, Sideways, Mildly Bullish, Bullish Turned
 Shareholding Snapshot : Mar 2026
Shareholding Compare (%holding)
Promoters
None
Held by 0 Schemes
Held by 0 FIIs
Sanjay Marathe (36.46%)
Namita Bhandare (1.49%)
25.83%
Quarterly Results Snapshot (Consolidated) - Mar'26 - YoY

YoY Growth in quarter ended Mar 2026 is 54.45% vs -15.21% in Mar 2025
YoY Growth in quarter ended Mar 2026 is 780.95% vs -90.50% in Mar 2025
Half Yearly Results Snapshot (Consolidated) - Sep'25
Growth in half year ended Sep 2025 is -1.75% vs -8.55% in Sep 2024

Growth in half year ended Sep 2025 is -87.03% vs -33.05% in Sep 2024
Nine Monthly Results Snapshot (Consolidated) - Dec'25
YoY Growth in nine months ended Dec 2025 is 3.83% vs -9.43% in Dec 2024
YoY Growth in nine months ended Dec 2025 is -49.06% vs -40.45% in Dec 2024
Annual Results Snapshot (Consolidated) - Mar'26
YoY Growth in year ended Mar 2026 is 15.20% vs -10.78% in Mar 2025
YoY Growth in year ended Mar 2026 is -4.60% vs -53.67% in Mar 2025
About Chemcrux Enterprises Ltd

Company Coordinates


