
Compare Oceanic Foods with Similar Stocks
Total Returns (Price + Dividend) 
Latest dividend: 0.09999999999999999 per share ex-dividend date: Sep-19-2019
Risk Adjusted Returns v/s
Returns Beta

News

Oceanic Foods Ltd Upgraded to Sell on Improved Valuation and Technicals
Oceanic Foods Ltd, a micro-cap player in the FMCG sector, has seen its investment rating upgraded from Strong Sell to Sell as of 1 July 2026. This change reflects a nuanced shift in the company’s valuation and technical outlook, despite flat financial performance in the latest quarter. Investors should weigh these developments carefully amid mixed signals from quality, valuation, financial trends, and technical indicators.
Read full news article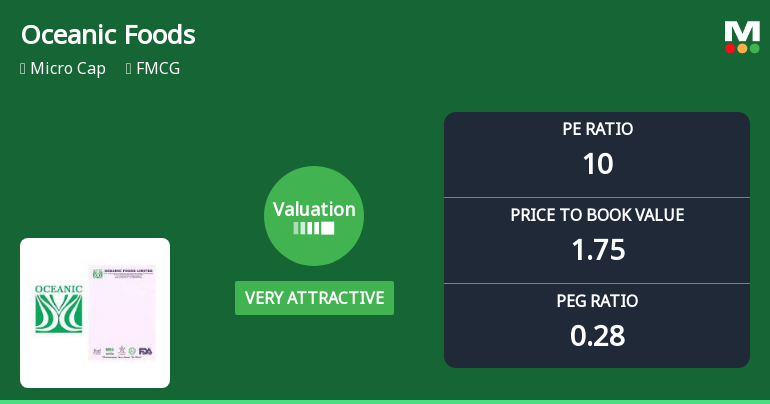
Oceanic Foods Ltd Valuation Shifts to Very Attractive Amid Mixed Market Returns
Oceanic Foods Ltd, a micro-cap player in the FMCG sector, has seen a notable improvement in its valuation parameters, shifting from an attractive to a very attractive grade. Despite a modest day change of -0.07%, the company’s price-to-earnings (P/E) and price-to-book value (P/BV) ratios now present a compelling case for value investors, especially when compared with peers and historical benchmarks.
Read full news article
Oceanic Foods Ltd Downgraded to Strong Sell Amid Mixed Financial and Technical Signals
Oceanic Foods Ltd, a micro-cap player in the FMCG sector, has seen its investment rating downgraded from Sell to Strong Sell as of 25 June 2026. This revision reflects a combination of deteriorating technical indicators, flat financial performance, and valuation concerns despite some attractive metrics. The company’s recent quarterly results and evolving market trends have prompted analysts to reassess its outlook across quality, valuation, financial trend, and technical parameters.
Read full news article Announcements
Closure of Trading Window
27-Jun-2026 | Source : BSEIntimation regarding Closure of Trading Window pursuant to SEBI (PIT) Regulation 2015 attached herewith
Compliances-Reg.24(A)-Annual Secretarial Compliance
30-May-2026 | Source : BSEAnnual Secretarial Compliance Report for the year ended on March 31 2026.
Announcement under Regulation 30 (LODR)-Newspaper Publication
27-May-2026 | Source : BSENewspaper Publication for the Audited Financial Result for Quarter and Year Ended on 31st March 2026
Corporate Actions

No Upcoming Board Meetings

Oceanic Foods Ltd has declared 1% dividend, ex-date: 19 Sep 19

No Splits history available

Oceanic Foods Ltd has announced 2:1 bonus issue, ex-date: 27 Jun 19

No Rights history available
Quality key factors
Valuation key factors
Technicals key factors
 Technical Indicator Scale: Bearish, Mildly Bearish, Sideways, Mildly Bullish, Bullish Turned
 Shareholding Snapshot : Mar 2026
Shareholding Compare (%holding)
Promoters
None
Held by 0 Schemes
Held by 0 FIIs
Ajesh V. Patel (74.07%)
Ritaben Chandrakant Sadaria (3.23%)
24.96%
Quarterly Results Snapshot (Standalone) - Mar'26 - YoY

YoY Growth in quarter ended Mar 2026 is -13.30% vs 23.52% in Mar 2025
YoY Growth in quarter ended Mar 2026 is 23.84% vs 30.17% in Mar 2025
Half Yearly Results Snapshot (Standalone) - Sep'25
Growth in half year ended Sep 2025 is 29.29% vs 46.51% in Sep 2024
Growth in half year ended Sep 2025 is 43.69% vs 146.67% in Sep 2024
Nine Monthly Results Snapshot (Standalone) - Dec'25
YoY Growth in nine months ended Dec 2025 is 25.94% vs 37.64% in Dec 2024
YoY Growth in nine months ended Dec 2025 is 41.57% vs 151.09% in Dec 2024
Annual Results Snapshot (Standalone) - Mar'26
YoY Growth in year ended Mar 2026 is 14.03% vs 33.05% in Mar 2025
YoY Growth in year ended Mar 2026 is 36.16% vs 95.65% in Mar 2025
About Oceanic Foods Ltd

Company Coordinates


