
Compare Classic Leasing with Similar Stocks
Stock DNA
Non Banking Financial Company (NBFC)
INR 17 Cr (Micro Cap)
15.00
21
0.00%
-2.81
-31.82%
-4.90
Total Returns (Price + Dividend) 
Classic Leasing for the last several years.
Risk Adjusted Returns v/s
Returns Beta

News
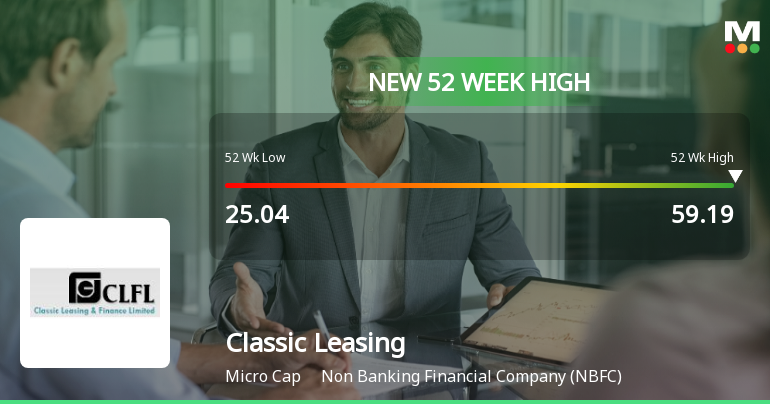
Broad-Based Technical Strength Lifts Classic Leasing & Finance Ltd to 52-Week High of Rs 59.19
From a 52-week low of Rs 25.04 to a fresh high of Rs 59.19 on 19 Jun 2026, Classic Leasing & Finance Ltd has more than doubled in value over the past year, outpacing the Sensex which declined by 5.77% in the same period. This remarkable price momentum is underpinned by a confluence of technical indicators signalling sustained strength.
Read full news articleAre Classic Leasing & Finance Ltd latest results good or bad?
Classic Leasing & Finance Ltd's latest financial results for Q4 FY26 indicate a significant operational turnaround after a prolonged period of dormancy. The company reported net sales of ₹0.46 crores, reflecting an 84.00% increase quarter-on-quarter and year-on-year, suggesting a recovery in business activity. The net profit for the same quarter was ₹0.46 crores, which marks a substantial year-on-year growth of 475.00%, indicating improved profitability metrics. The operating margin also showed notable improvement, reaching 89.13%, up from 84.00% in the previous quarter, which highlights enhanced operational efficiency. However, despite these positive trends in revenue and profitability, the company's balance sheet presents serious concerns. Shareholder equity is reported at ₹-4.64 crores, indicating a technical insolvency position, and the current liabilities significantly exceed current assets, resulting...
Read full news article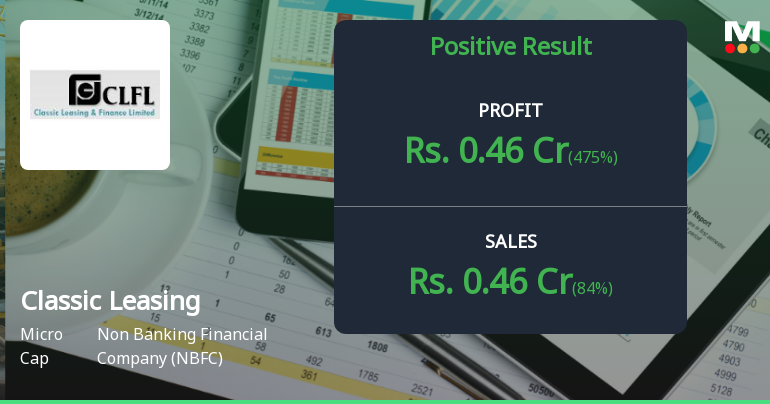
Classic Leasing & Finance Q4 FY26: Profitability Surge Masks Deep-Rooted Balance Sheet Concerns
Classic Leasing & Finance Ltd., a Kolkata-based non-banking financial company operating since 1984, reported a dramatic 475.00% year-on-year surge in net profit for Q4 FY26, reaching ₹0.46 crores compared to ₹0.08 crores in Q4 FY25. However, the micro-cap NBFC's stock has tumbled 4.77% following the results announcement, closing at ₹44.32 on May 27, 2026, as investors grapple with the company's negative book value of ₹-15.48 per share and severely eroded shareholder equity of ₹-4.64 crores.
Read full news article Announcements
Announcement under Regulation 30 (LODR)-Newspaper Publication
05-Jun-2026 | Source : BSENewspaper Clippings of Advertisement published on 05.06.2026
Notice Of Extra-Ordinary General Meeting (EGM) Dated 27Th June 2026.
03-Jun-2026 | Source : BSENotice of Extra -Ordinary General Meeting (EGM) dated 27th June 2026.
Announcement under Regulation 30 (LODR)-Newspaper Publication
28-May-2026 | Source : BSENewspaper clipping of the financial results for the quarter and year ended 31.03.2026.
Corporate Actions

No Upcoming Board Meetings

No Dividend history available

No Splits history available

No Bonus history available

No Rights history available
Quality key factors
Valuation key factors
Technicals key factors
 Technical Indicator Scale: Bearish, Mildly Bearish, Sideways, Mildly Bullish, Bullish Turned
 Shareholding Snapshot : Mar 2026
Shareholding Compare (%holding)
Non Institution
None
Held by 0 Schemes
Held by 0 FIIs
Manju Kumari Bothra (22.28%)
Sunlike Exim Pvt Ltd (22.86%)
8.11%
Quarterly Results Snapshot (Standalone) - Mar'26 - YoY

YoY Growth in quarter ended Mar 2026 is 84.00% vs 212.50% in Mar 2025

YoY Growth in quarter ended Mar 2026 is 475.00% vs -50.00% in Mar 2025
Half Yearly Results Snapshot (Standalone) - Sep'25
Growth in half year ended Sep 2025 is 65.38% vs 100.00% in Sep 2024
Growth in half year ended Sep 2025 is 73.91% vs 666.67% in Sep 2024
Nine Monthly Results Snapshot (Standalone) - Dec'25
YoY Growth in nine months ended Dec 2025 is 54.55% vs 91.30% in Dec 2024
YoY Growth in nine months ended Dec 2025 is 73.68% vs 1,166.67% in Dec 2024
Annual Results Snapshot (Standalone) - Mar'26
YoY Growth in year ended Mar 2026 is 65.22% vs 305.88% in Mar 2025
YoY Growth in year ended Mar 2026 is 143.48% vs 155.56% in Mar 2025
About Classic Leasing & Finance Ltd

Company Coordinates


