
Compare Meera Industries with Similar Stocks
Dashboard
With a Operating Losses, the company has a Weak Long Term Fundamental Strength
- Company's ability to service its debt is weak with a poor EBIT to Interest (avg) ratio of 1.89
- The company has been able to generate a Return on Equity (avg) of 6.37% signifying low profitability per unit of shareholders funds
Negative results in Mar 26
With ROCE of 3.1, it has a Very Expensive valuation with a 3.2 Enterprise value to Capital Employed
Stock DNA
Industrial Manufacturing
INR 107 Cr (Micro Cap)
108.00
92
0.50%
0.17
3.31%
3.59
Total Returns (Price + Dividend) 
Latest dividend: 0.2476153846153846 per share ex-dividend date: Nov-28-2025
Risk Adjusted Returns v/s
Returns Beta

News
Meera Industries Ltd is Rated Strong Sell
Meera Industries Ltd is rated Strong Sell by MarketsMOJO, with this rating last updated on 02 June 2026. However, the analysis and financial metrics discussed below reflect the company’s current position as of 16 June 2026, providing investors with the latest insights into the stock’s fundamentals, valuation, financial trends, and technical outlook.
Read full news article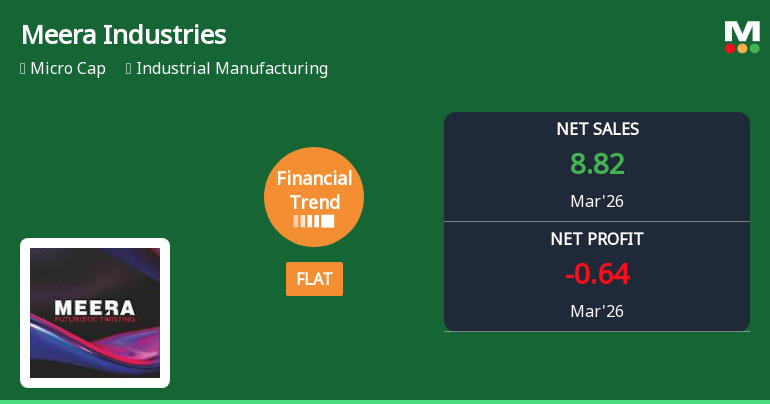
Meera Industries Ltd Reports Stabilised Quarterly Performance Amid Flat Financial Trend
Meera Industries Ltd, a micro-cap player in the industrial manufacturing sector, has reported a flat financial performance for the quarter ended March 2026, signalling a tentative halt to its recent downward trend. Despite persistent challenges reflected in zero PBDIT and PBT figures, the company’s financial trend score improved from -15 to -5 over the past three months, suggesting a stabilisation phase that investors will watch closely.
Read full news article
Meera Industries Ltd Downgraded to Strong Sell Amid Weak Financials and Mixed Technicals
Meera Industries Ltd, a micro-cap player in the industrial manufacturing sector, has seen its investment rating downgraded from Sell to Strong Sell as of 2 June 2026. This shift reflects deteriorating financial fundamentals, expensive valuation metrics, and a complex technical outlook despite some positive long-term price returns. The downgrade highlights growing concerns over the company’s operational losses, weak profitability, and mixed technical indicators that have tempered investor confidence.
Read full news article Announcements
Compliances-Reg.24(A)-Annual Secretarial Compliance
30-May-2026 | Source : BSEsubmission of Reg 24(A) ASCR
Compliances-Reg.24(A)-Annual Secretarial Compliance
30-May-2026 | Source : BSEsubmission of Reg 24(A) ASCR
Announcement under Regulation 30 (LODR)-Cessation
29-May-2026 | Source : BSECessation of Internal Auditor
Corporate Actions

No Upcoming Board Meetings

Meera Industries Ltd has declared 5% dividend, ex-date: 28 Nov 25

Meera Industries Ltd has announced 5:10 stock split, ex-date: 06 Mar 26

Meera Industries Ltd has announced 7:5 bonus issue, ex-date: 06 Feb 20

No Rights history available
Quality key factors
Valuation key factors
Technicals key factors
 Technical Indicator Scale: Bearish, Mildly Bearish, Sideways, Mildly Bullish, Bullish Turned
 Shareholding Snapshot : Mar 2026
Shareholding Compare (%holding)
Promoters
None
Held by 0 Schemes
Held by 0 FIIs
Bijal Dharmeshbhai Desai (29.12%)
Kamlesh Ramanlal Naik (1.97%)
33.58%
Quarterly Results Snapshot (Consolidated) - Mar'26 - YoY

YoY Growth in quarter ended Mar 2026 is 19.19% vs -22.92% in Mar 2025

YoY Growth in quarter ended Mar 2026 is -436.84% vs -68.33% in Mar 2025
Half Yearly Results Snapshot (Consolidated) - Sep'25
Growth in half year ended Sep 2025 is -2.88% vs 60.82% in Sep 2024
Growth in half year ended Sep 2025 is -39.27% vs 447.50% in Sep 2024
Nine Monthly Results Snapshot (Consolidated) - Dec'25
YoY Growth in nine months ended Dec 2025 is -10.60% vs 57.91% in Dec 2024
YoY Growth in nine months ended Dec 2025 is -54.11% vs 310.47% in Dec 2024
Annual Results Snapshot (Consolidated) - Mar'26
YoY Growth in year ended Mar 2026 is -5.07% vs 32.22% in Mar 2025
YoY Growth in year ended Mar 2026 is -73.66% vs 154.79% in Mar 2025
About Meera Industries Ltd

Company Coordinates


