
Compare Star Cement with Similar Stocks
Stock DNA
Cement & Cement Products
INR 8,548 Cr (Small Cap)
21.00
33
0.94%
0.15
12.59%
2.69
Total Returns (Price + Dividend) 
Latest dividend: 1 per share ex-dividend date: Feb-12-2026
Risk Adjusted Returns v/s
Returns Beta

News
Star Cement Ltd. is Rated Sell
Star Cement Ltd. is rated 'Sell' by MarketsMOJO, with this rating last updated on 11 May 2026. However, the analysis and financial metrics discussed here reflect the stock’s current position as of 14 June 2026, providing investors with the latest insights into the company’s fundamentals, valuation, financial trends, and technical outlook.
Read full news article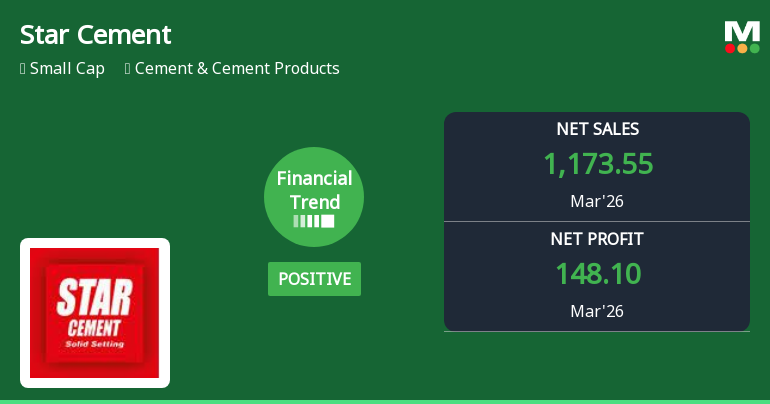
Star Cement Ltd. Reports Record Quarterly Performance Amid Flat Financial Trend
Star Cement Ltd., a small-cap player in the Cement & Cement Products sector, has delivered its strongest quarterly results to date in March 2026, setting new benchmarks across key financial metrics. Despite this, the company’s overall financial trend has shifted from positive to flat, prompting a downgrade in its Mojo Grade from Hold to Sell as of 11 May 2026.
Read full news article
Star Cement Ltd. is Rated Sell
Star Cement Ltd. is rated 'Sell' by MarketsMOJO, with this rating last updated on 11 May 2026. However, the analysis and financial metrics discussed here reflect the stock's current position as of 03 June 2026, providing investors with an up-to-date perspective on the company’s fundamentals, valuation, financial trends, and technical outlook.
Read full news article Announcements
Intimation Of Dissemination Of Communication Regarding Re-Launch Of Second 100 Days Campaign Of IEPF - Disclosure Under Regulation 30 Of The SEBI (Listing Obligations And Disclosure Requirements) Regulations 2015
09-Jun-2026 | Source : BSEEnclosed herewith the communication disseminated on the social media of the Company relating to re-launch of second 100 days campaign Saksham Niveshak to enable the shareholders to update their KYC.
Announcement under Regulation 30 (LODR)-Investor Presentation
05-Jun-2026 | Source : BSEInvestors Presentation for the 4th Quarter and Year Ended 31st March 2026
Compliances-Reg.24(A)-Annual Secretarial Compliance
28-May-2026 | Source : BSEAnnual Secretarial Compliance Report under Regulation 24A of the SEBI (Listing Obligations & Disclosure Requirements) Regulations 2015 is enclosed herewith.
Corporate Actions

No Upcoming Board Meetings

Star Cement Ltd. has declared 100% dividend, ex-date: 12 Feb 26

No Splits history available

No Bonus history available

No Rights history available
Quality key factors
Valuation key factors
Technicals key factors
 Technical Indicator Scale: Bearish, Mildly Bearish, Sideways, Mildly Bullish, Bullish Turned
 Shareholding Snapshot : Mar 2026
Shareholding Compare (%holding)
Promoters
1.327
Held by 7 Schemes (2.52%)
Held by 78 FIIs (2.27%)
Sajjan Bhajanka (12.02%)
Ultratech Cement Limited (8.42%)
6.9%
Quarterly Results Snapshot (Consolidated) - Mar'26 - YoY

YoY Growth in quarter ended Mar 2026 is 11.54% vs 15.17% in Mar 2025
YoY Growth in quarter ended Mar 2026 is 20.24% vs 40.49% in Mar 2025
Half Yearly Results Snapshot (Consolidated) - Sep'25

Growth in half year ended Sep 2025 is 23.72% vs 3.48% in Sep 2024
Growth in half year ended Sep 2025 is 363.30% vs -72.54% in Sep 2024
Nine Monthly Results Snapshot (Consolidated) - Dec'25
YoY Growth in nine months ended Dec 2025 is 23.29% vs 5.72% in Dec 2024
YoY Growth in nine months ended Dec 2025 is 435.17% vs -77.90% in Dec 2024
Annual Results Snapshot (Consolidated) - Mar'26
YoY Growth in year ended Mar 2026 is 19.38% vs 8.68% in Mar 2025
YoY Growth in year ended Mar 2026 is 132.79% vs -42.73% in Mar 2025
About Star Cement Ltd.

Company Coordinates


