
Compare Avadh Sugar with Similar Stocks
Dashboard
Weak Long Term Fundamental Strength with a -5.43% CAGR growth in Operating Profits over the last 5 years
- Low ability to service debt as the company has a high Debt to EBITDA ratio of 6.36 times
- The company has been able to generate a Return on Capital Employed (avg) of 9.94% signifying low profitability per unit of total capital (equity and debt)
- PBT LESS OI(Q) At Rs 82.65 cr has Fallen at -25.24%
- PAT(Q) At Rs 55.03 cr has Fallen at -23.2%
- ROCE(HY) Lowest at 6.50%
Falling Participation by Institutional Investors
Consistent Underperformance against the benchmark over the last 3 years
Total Returns (Price + Dividend) 
Latest dividend: 10 per share ex-dividend date: Jul-16-2025
Risk Adjusted Returns v/s
Returns Beta

News
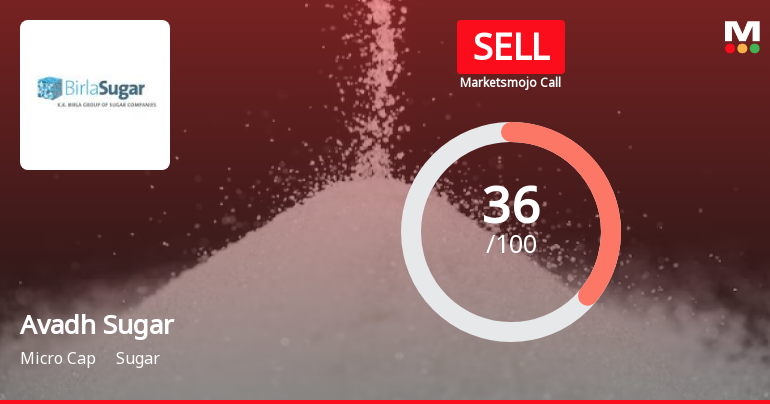
Avadh Sugar & Energy Ltd is Rated Sell
Avadh Sugar & Energy Ltd is rated 'Sell' by MarketsMOJO, with this rating last updated on 13 May 2026. However, the analysis and financial metrics discussed here reflect the company’s current position as of 16 June 2026, providing investors with an up-to-date perspective on the stock’s fundamentals, valuation, financial trends, and technical outlook.
Read full news article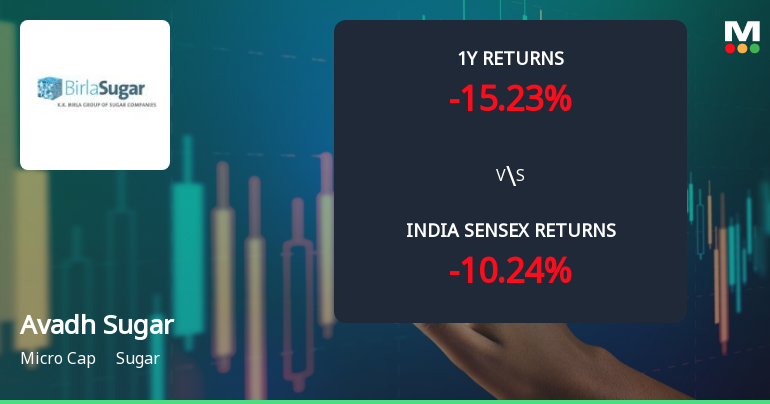
Avadh Sugar & Energy Ltd Sees Technical Momentum Shift Amid Mixed Market Returns
Avadh Sugar & Energy Ltd has experienced a notable shift in its technical momentum, with key indicators signalling a transition from bullish to mildly bullish territory. Despite a recent decline in share price, the stock’s longer-term trends and oscillators present a complex picture for investors navigating the sugar sector’s micro-cap landscape.
Read full news article
Avadh Sugar & Energy Ltd is Rated Sell
Avadh Sugar & Energy Ltd is rated 'Sell' by MarketsMOJO, with this rating last updated on 13 May 2026. However, the analysis and financial metrics discussed here reflect the stock's current position as of 08 June 2026, providing investors with an up-to-date view of the company’s fundamentals, returns, and market performance.
Read full news article Announcements
Corporate Action - Record Date For Dividend
22-Jun-2026 | Source : BSECorporate Action - Record Date for Dividend
Announcement under Regulation 30 (LODR)-Change in Directorate
10-Jun-2026 | Source : BSEAppointment of Mr Rahul Chhabra as an Independent Director
Compliances-Reg.24(A)-Annual Secretarial Compliance
29-May-2026 | Source : BSESubmission of Annual Secretarial Compliance Report
Corporate Actions

No Upcoming Board Meetings

Avadh Sugar & Energy Ltd has declared 100% dividend, ex-date: 16 Jul 25

No Splits history available

Avadh Sugar & Energy Ltd has announced 1:1 bonus issue, ex-date: 27 Jun 19

No Rights history available
Quality key factors
Valuation key factors
Technicals key factors
 Technical Indicator Scale: Bearish, Mildly Bearish, Sideways, Mildly Bullish, Bullish Turned
 Shareholding Snapshot : Mar 2026
Shareholding Compare (%holding)
Promoters
None
Held by 4 Schemes (0.01%)
Held by 27 FIIs (1.76%)
New India Retailing And Investment Ltd (9.72%)
Anil Kumar Goel (5.53%)
27.08%
Quarterly Results Snapshot (Standalone) - Mar'26 - YoY

YoY Growth in quarter ended Mar 2026 is -1.20% vs 9.52% in Mar 2025
YoY Growth in quarter ended Mar 2026 is -22.42% vs 29.64% in Mar 2025
Half Yearly Results Snapshot (Standalone) - Sep'25

Growth in half year ended Sep 2025 is 3.34% vs -9.43% in Sep 2024
Growth in half year ended Sep 2025 is -257.56% vs -81.35% in Sep 2024
Nine Monthly Results Snapshot (Standalone) - Dec'25
YoY Growth in nine months ended Dec 2025 is 3.38% vs -5.64% in Dec 2024
YoY Growth in nine months ended Dec 2025 is -89.54% vs -77.67% in Dec 2024
Annual Results Snapshot (Standalone) - Mar'26
YoY Growth in year ended Mar 2026 is 2.20% vs -2.15% in Mar 2025
YoY Growth in year ended Mar 2026 is -34.83% vs -31.36% in Mar 2025
About Avadh Sugar & Energy Ltd

Company Coordinates


