
Compare Globalspace Tech with Similar Stocks
Dashboard
Weak Long Term Fundamental Strength with an average Return on Capital Employed (ROCE) of 8.22%
- Low ability to service debt as the company has a high Debt to EBITDA ratio of 0.65 times
With a growth in Net Sales of 83.31%, the company declared Very Positive results in Mar 26
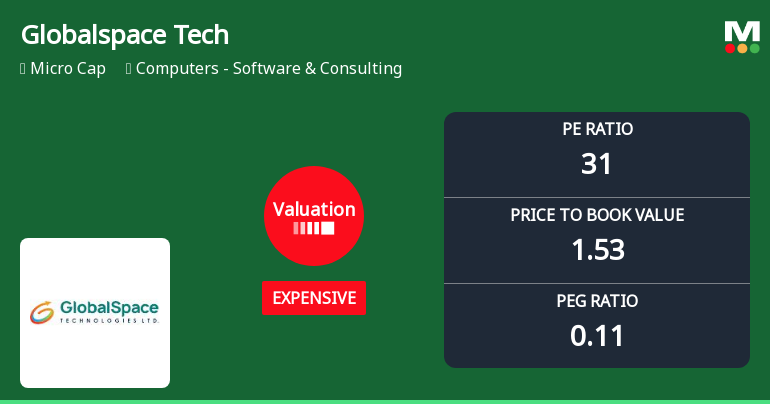
With ROE of 5, it has a Expensive valuation with a 1.5 Price to Book Value
Majority shareholders : Promoters
Market Beating Performance
Stock DNA
Computers - Software & Consulting
INR 85 Cr (Micro Cap)
31.00
20
0.00%
0.05
5.00%
1.53
Total Returns (Price + Dividend) 
Latest dividend: 0.2 per share ex-dividend date: Nov-11-2021
Risk Adjusted Returns v/s
Returns Beta

News
Globalspace Technologies Ltd Valuation Shifts Signal Price Attractiveness Challenges
Globalspace Technologies Ltd has experienced a notable shift in its valuation parameters, moving from a fair to an expensive rating, reflecting evolving investor sentiment amid mixed financial metrics and sector comparisons. This article analyses the recent changes in price-to-earnings (P/E) and price-to-book value (P/BV) ratios, contrasting them with historical averages and peer benchmarks to assess the stock’s price attractiveness.
Read full news article
Globalspace Technologies Ltd is Rated Hold
Globalspace Technologies Ltd is rated 'Hold' by MarketsMOJO, with this rating last updated on 13 May 2026. However, the analysis and financial metrics discussed here reflect the company’s current position as of 20 July 2026, providing investors with the latest insights into its performance and outlook.
Read full news article
Globalspace Technologies Ltd is Rated Hold
Globalspace Technologies Ltd is rated 'Hold' by MarketsMOJO, with this rating last updated on 13 May 2026. However, the analysis and financial metrics discussed here reflect the company’s current position as of 09 July 2026, providing investors with an up-to-date view of its fundamentals, returns, and market performance.
Read full news article Announcements
Compliances-Certificate under Reg. 74 (5) of SEBI (DP) Regulations 2018
14-Jul-2026 | Source : BSEIn accordance with Regulation 74(5) of the SEBI (Depositories and Participants) Regulations 2018; we hereby confirm that the Company has not received any demat/remat requests for shares for the quarter ended June 30 2026.
Closure of Trading Window
26-Jun-2026 | Source : BSEPursuant to Securities and Exchange Board of India (Prohibition of Insider Trading) Regulations 2015 (including any amendment thereto) we wish to inform you that the Trading Window for dealing in securities of the Company by all Designated Persons and their Immediate Relatives as defined under the Code shall be closed from Wednesday 1st July 2026 till the expiry of 48 hours after the declaration of the Unaudited Financial Results of the Company for the quarter ending 30th June 2026.
Announcement under Regulation 30 (LODR)-Acquisition
18-Jun-2026 | Source : BSEThis is to inform you that pursuant to Regulation 30 read with Part A of Schedule III of the Securities and Exchange Board of India (Listing Obligations and Disclosure Requirements) Regulations 2015 the Board of Directors of the Company in their meeting held today i.e. 18th June 2026 has approved the acquisition of additional shareholding in Miljon Mediapp Private Limited subsidiary of the Company pursuant to conversion of loan granted by the Company into equity shareholding. The detailed disclosure as required under Regulation 30 of the SEBI (Listing Obligations and Disclosure Requirements) Regulations 2015 read with SEBI master Circular No. HO/49/14/14(7)2025-CFDPOD2/I/3762/2026 dated 30th January 2026 are enclosed as Annexure A.
Corporate Actions

No Upcoming Board Meetings

Globalspace Technologies Ltd has declared 2% dividend, ex-date: 11 Nov 21

No Splits history available

No Bonus history available

Globalspace Technologies Ltd has announced 2:1 rights issue, ex-date: 03 Nov 23
Quality key factors
Valuation key factors
Technicals key factors
 Technical Indicator Scale: Bearish, Mildly Bearish, Sideways, Mildly Bullish, Bullish Turned
 Shareholding Snapshot : Jun 2026
Shareholding Compare (%holding)
Promoters
None
Held by 0 Schemes
Held by 1 FIIs (0.15%)
Krishna Murari Singh (48.88%)
Rao Anand Ganesh (3.57%)
38.46%
Quarterly Results Snapshot (Consolidated) - Mar'26 - YoY

YoY Growth in quarter ended Mar 2026 is 83.31% vs 86.17% in Mar 2025

YoY Growth in quarter ended Mar 2026 is 1,733.33% vs 96.29% in Mar 2025
Half Yearly Results Snapshot (Consolidated) - Mar'26
Growth in half year ended Mar 2026 is 73.92% vs -13.01% in Sep 2025
Growth in half year ended Mar 2026 is 6,925.00% vs 101.59% in Sep 2025
Nine Monthly Results Snapshot (Consolidated) - Dec'25
YoY Growth in nine months ended Dec 2025 is 3.32% vs 94.72% in Dec 2024
YoY Growth in nine months ended Dec 2025 is 121.62% vs -277.55% in Dec 2024
Annual Results Snapshot (Consolidated) - Mar'26
YoY Growth in year ended Mar 2026 is 19.56% vs 48.19% in Mar 2025
YoY Growth in year ended Mar 2026 is 242.50% vs 43.34% in Mar 2025
About Globalspace Technologies Ltd

Company Coordinates


