
Compare One Point One with Similar Stocks
Dashboard
Strong ability to service debt as the company has a low Debt to EBITDA ratio of 3.03 times
Healthy long term growth as Net Sales has grown by an annual rate of 25.27% and Operating profit at 34.13%
The company has declared Positive results for the last 4 consecutive quarters
With ROCE of 7.3, it has a Attractive valuation with a 2.6 Enterprise value to Capital Employed
35.99% of Promoter Shares are Pledged
Stock DNA
Commercial Services & Supplies
INR 1,411 Cr (Micro Cap)
36.00
25
0.00%
0.36
8.79%
3.17
Total Returns (Price + Dividend) 
Latest dividend: 0.00169 per share ex-dividend date: Sep-12-2019
Risk Adjusted Returns v/s
Returns Beta

News

One Point One Solutions Ltd Technical Momentum Shifts to Sideways Trend
One Point One Solutions Ltd, a micro-cap player in the Commercial Services & Supplies sector, has exhibited a notable shift in its technical momentum, moving from a mildly bearish stance to a sideways trend. This change is underscored by recent price action and evolving technical indicators, signalling a potential stabilisation phase after a period of weakness.
Read full news article
One Point One Solutions Ltd is Rated Hold
One Point One Solutions Ltd is rated Hold by MarketsMOJO, with this rating last updated on 06 July 2026. While the rating change occurred on that date, the analysis and financial metrics discussed here reflect the stock’s current position as of 11 July 2026, providing investors with the most up-to-date view of the company’s fundamentals and market standing.
Read full news article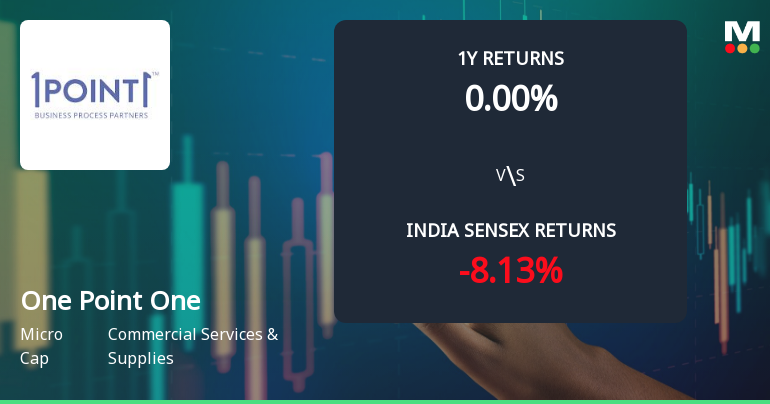
One Point One Solutions Ltd Technical Momentum Shifts Amid Mild Bearish Trend
One Point One Solutions Ltd, a micro-cap player in the Commercial Services & Supplies sector, has experienced a notable shift in its technical momentum, moving from a sideways trend to a mildly bearish stance. This change is underscored by recent price movements, technical indicator signals, and a downgrade in its Mojo Grade from Sell to Hold, reflecting a nuanced outlook for investors navigating this stock amid broader market fluctuations.
Read full news article Announcements
General Update
16-Jul-2026 | Source : BSEGeneral update in respect of successful completion of acquisition of 100% stake in ITCube Solutions Pvt. Ltd.
Announcement under Regulation 30 (LODR)-Allotment of ESOP / ESPS
15-Jul-2026 | Source : BSEDear Sir/Madam Pursuant to Regulation 30 read with Para A of Part A of SEBI (LODR) Regulations 2015 we wish to inform you that the Nomination and Remuneration Committee of Board of Directors of the Company at its meeting held today i.e. 15 July 2026 has approved the Grant of 199645 Employee Stock Options to eligible employee of the Company. The said has been made under the One Point One Employee Stock Plan 2022 which was approved by the shareholder through Postal Ballot on 13 July 2022.
Compliances-Certificate under Reg. 74 (5) of SEBI (DP) Regulations 2018
09-Jul-2026 | Source : BSEDear Sir/ Madam Please find attached certificate under section 74(5) of Depository Participant Regulations 2018 for quarter ended 30 June 2026.
Corporate Actions

No Upcoming Board Meetings

One Point One Solutions Ltd has declared 1% dividend, ex-date: 12 Sep 19

One Point One Solutions Ltd has announced 2:10 stock split, ex-date: 18 Jan 22

One Point One Solutions Ltd has announced 1:2 bonus issue, ex-date: 18 Jan 22

No Rights history available
Quality key factors
Valuation key factors
Technicals key factors
 Technical Indicator Scale: Bearish, Mildly Bearish, Sideways, Mildly Bullish, Bullish Turned
 Shareholding Snapshot : Jun 2026
Shareholding Compare (%holding)
Promoters
35.9851
Held by 0 Schemes
Held by 13 FIIs (5.22%)
Akshay Chhabra (30.64%)
Gkk Capital Markets Private Limited (2.85%)
25.82%
Quarterly Results Snapshot (Consolidated) - Mar'26 - YoY

YoY Growth in quarter ended Mar 2026 is 43.48% vs 28.06% in Mar 2025

YoY Growth in quarter ended Mar 2026 is 18.08% vs 31.23% in Mar 2025
Half Yearly Results Snapshot (Consolidated) - Sep'25
Growth in half year ended Sep 2025 is 13.14% vs 63.51% in Sep 2024
Growth in half year ended Sep 2025 is 20.64% vs 82.74% in Sep 2024
Nine Monthly Results Snapshot (Consolidated) - Dec'25
YoY Growth in nine months ended Dec 2025 is 14.72% vs 61.24% in Dec 2024
YoY Growth in nine months ended Dec 2025 is 14.37% vs 65.90% in Dec 2024
Annual Results Snapshot (Consolidated) - Mar'26
YoY Growth in year ended Mar 2026 is 22.24% vs 51.01% in Mar 2025
YoY Growth in year ended Mar 2026 is 15.35% vs 55.10% in Mar 2025
About One Point One Solutions Ltd

Company Coordinates


