
Compare Brand Concepts with Similar Stocks
Stock DNA
Garments & Apparels
INR 224 Cr (Micro Cap)
111.00
48
0.00%
2.12
2.30%
2.66
Total Returns (Price + Dividend) 
Latest dividend: 0.5 per share ex-dividend date: Oct-19-2023
Risk Adjusted Returns v/s
Returns Beta

News

Brand Concepts Ltd Falls to 52-Week Low of Rs 167 as Sell-Off Deepens
For the fifth consecutive session, Brand Concepts Ltd closed lower, slipping to a fresh 52-week low of Rs 167 on 24 Jun 2026. This marks a steep decline of 50.75% over the past year, significantly underperforming the Sensex's modest 6.17% fall during the same period.
Read full news article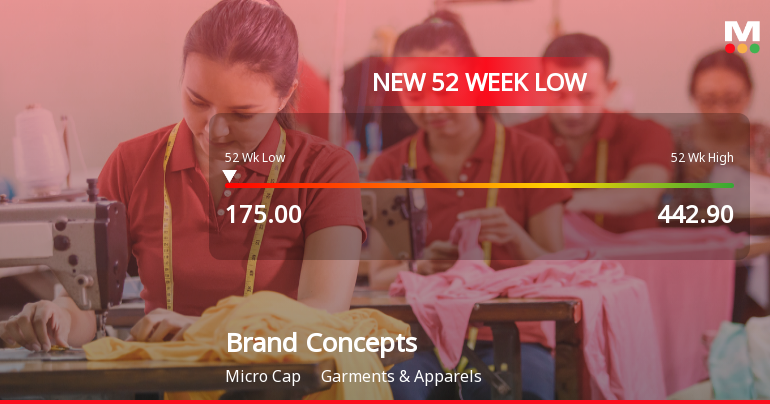
Brand Concepts Ltd Falls to 52-Week Low of Rs 175 as Sell-Off Deepens
A sharp decline has pushed Brand Concepts Ltd to a fresh 52-week low of Rs 175 on 16 Jun 2026, marking a near 61% drop from its peak of Rs 449 within the last year. This steep fall comes despite pockets of resilience in the company’s financials, highlighting a complex interplay of market sentiment and fundamental factors.
Read full news article
Brand Concepts Ltd is Rated Sell by MarketsMOJO
Brand Concepts Ltd is rated Sell by MarketsMOJO, with this rating last updated on 20 May 2026. While the rating change occurred on that date, the analysis and financial metrics discussed here reflect the stock’s current position as of 15 June 2026, providing investors with an up-to-date view of the company’s fundamentals, returns, and market performance.
Read full news article Announcements
Announcement under Regulation 30 (LODR)-Analyst / Investor Meet - Intimation
17-Jun-2026 | Source : BSEBrand Concepts Limited has informed the exchange about the schedule of Analyst/ Investor Meet to be held on Friday 19th June 2026 with Credent Asset Management.
Announcement under Regulation 30 (LODR)-Investor Presentation
27-May-2026 | Source : BSEBrand Concepts Limited has informed the exchange about the Investor Presentation for the Quarter and Year ended 31.03.2026
Announcement under Regulation 30 (LODR)-Newspaper Publication
21-May-2026 | Source : BSEBrand Concepts Limited has informed the exchange about the Newspaper Publication of Audited Financial Results for the quarter and year ended 31.03.2026.
Corporate Actions

No Upcoming Board Meetings

Brand Concepts Ltd has declared 5% dividend, ex-date: 19 Oct 23

No Splits history available

No Bonus history available

No Rights history available
Quality key factors
Valuation key factors
Technicals key factors
 Technical Indicator Scale: Bearish, Mildly Bearish, Sideways, Mildly Bullish, Bullish Turned
 Shareholding Snapshot : Mar 2026
Shareholding Compare (%holding)
Promoters
None
Held by 0 Schemes
Held by 1 FIIs (0.0%)
Pradeep Maheshwari (19.78%)
Abhinav Kumar (8.06%)
42.56%
Quarterly Results Snapshot (Consolidated) - Mar'26 - YoY

YoY Growth in quarter ended Mar 2026 is 25.03% vs 8.51% in Mar 2025

YoY Growth in quarter ended Mar 2026 is -43.59% vs -19.59% in Mar 2025
Half Yearly Results Snapshot (Consolidated) - Sep'25
Growth in half year ended Sep 2025 is 9.83% vs 21.39% in Sep 2024
Growth in half year ended Sep 2025 is -108.78% vs -35.57% in Sep 2024
Nine Monthly Results Snapshot (Consolidated) - Dec'25
YoY Growth in nine months ended Dec 2025 is 13.95% vs 17.45% in Dec 2024
YoY Growth in nine months ended Dec 2025 is -94.99% vs -46.38% in Dec 2024
Annual Results Snapshot (Consolidated) - Mar'26
YoY Growth in year ended Mar 2026 is 19.23% vs 0.61% in Mar 2025
YoY Growth in year ended Mar 2026 is -79.16% vs -56.88% in Mar 2025
About Brand Concepts Ltd

Company Coordinates


