
Compare Chemfab Alka. with Similar Stocks
Dashboard
Poor long term growth as Operating profit has grown by an annual rate -182.98% of over the last 5 years
The company has declared Negative results for the last 12 consecutive quarters
Risky - Negative Operating Profits
Despite the size of the company, domestic mutual funds hold only 0.25% of the company
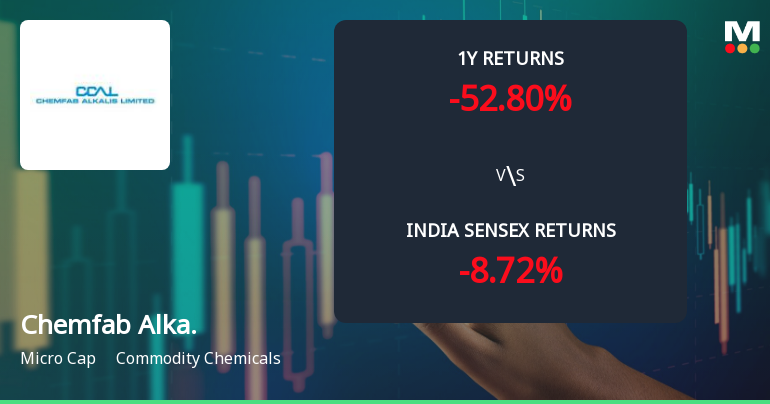
Underperformed the market in the last 1 year
Stock DNA
Commodity Chemicals
INR 545 Cr (Micro Cap)
NA (Loss Making)
44
0.33%
0.30
-0.91%
1.38
Total Returns (Price + Dividend) 
Latest dividend: 1.2 per share ex-dividend date: Sep-04-2025
Risk Adjusted Returns v/s
Returns Beta

News
Chemfab Alkalis Ltd Technical Momentum Shifts Amid Bearish Sentiment
Chemfab Alkalis Ltd, a micro-cap player in the commodity chemicals sector, has experienced a notable shift in its technical momentum, reflecting a complex interplay of bearish and mildly bullish signals. Despite a recent downgrade to a Strong Sell rating, the stock’s technical indicators reveal nuanced trends that investors should carefully analyse amid ongoing market volatility.
Read full news article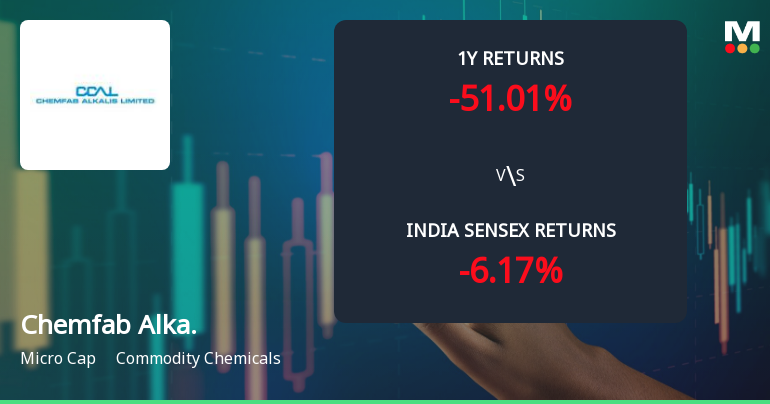
Chemfab Alkalis Ltd Faces Bearish Momentum Amid Technical Downturn
Chemfab Alkalis Ltd, a micro-cap player in the commodity chemicals sector, has experienced a notable shift in its technical momentum, with key indicators signalling a bearish trend. The stock’s recent price action, combined with mixed technical signals, suggests increasing downside pressure amid a challenging market environment.
Read full news article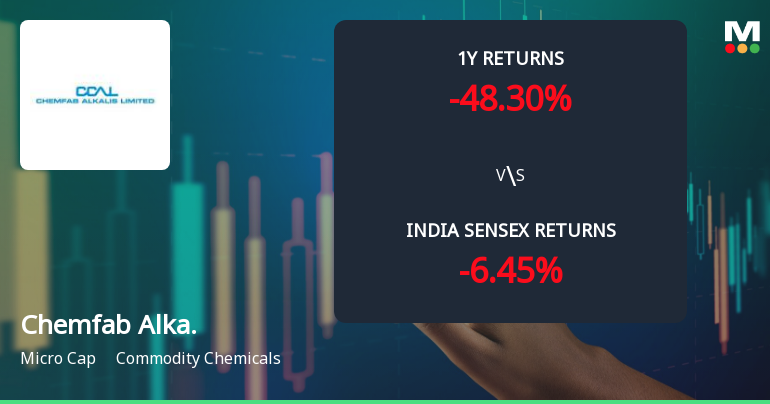
Chemfab Alkalis Ltd Technical Momentum Shifts Amid Bearish Sentiment
Chemfab Alkalis Ltd, a micro-cap player in the commodity chemicals sector, has experienced a notable shift in its technical momentum, reflecting a complex interplay of bearish and mildly bullish signals. Despite a recent downgrade to a Strong Sell rating by MarketsMOJO, the stock’s technical indicators reveal nuanced trends that merit close attention from investors navigating volatile market conditions.
Read full news article Announcements
Closure of Trading Window
26-Jun-2026 | Source : BSESubmission of Letter for intimating the closure of trading window period w.e.f 1st July 2026 till the expiry of 48 hours after the announcement of the Un-Audited Standalone and Consolidated financial results for the quarter ended 30th June 2026.
Announcement under Regulation 30 (LODR)-Newspaper Publication
19-Jun-2026 | Source : BSESubmission of copies of newspaper advertisement on Notice of transfer of shares to IEPFA.
Announcement under Regulation 30 (LODR)-Newspaper Publication
06-Jun-2026 | Source : BSESubmission of copy of newspaper publication wrt. SEBI circular dated 30th Jan 2026 on special window for transfer and dematerialisation of physical securities.
Corporate Actions

No Upcoming Board Meetings

Chemfab Alkalis Ltd has declared 12% dividend, ex-date: 04 Sep 25

No Splits history available

No Bonus history available

No Rights history available
Quality key factors
Valuation key factors
Technicals key factors
 Technical Indicator Scale: Bearish, Mildly Bearish, Sideways, Mildly Bullish, Bullish Turned
 Shareholding Snapshot : Mar 2026
Shareholding Compare (%holding)
Promoters
None
Held by 2 Schemes (0.07%)
Held by 2 FIIs (0.04%)
Dr Rao Holdings Pte Ltd (47.04%)
V. M. Srinivasan (1.8%)
21.63%
Quarterly Results Snapshot (Consolidated) - Mar'26 - QoQ

QoQ Growth in quarter ended Mar 2026 is 9.74% vs -11.00% in Dec 2025
QoQ Growth in quarter ended Mar 2026 is 110.79% vs -121.39% in Dec 2025
Half Yearly Results Snapshot (Consolidated) - Sep'25
Growth in half year ended Sep 2025 is 6.10% vs -0.14% in Sep 2024
Growth in half year ended Sep 2025 is 50.00% vs -97.39% in Sep 2024
Nine Monthly Results Snapshot (Consolidated) - Dec'25

YoY Growth in nine months ended Dec 2025 is -2.40% vs -1.20% in Dec 2024
YoY Growth in nine months ended Dec 2025 is -274.55% vs -89.29% in Dec 2024
Annual Results Snapshot (Consolidated) - Mar'26
YoY Growth in year ended Mar 2026 is -6.98% vs 2.16% in Mar 2025
YoY Growth in year ended Mar 2026 is 50.58% vs -126.37% in Mar 2025
About Chemfab Alkalis Ltd

Company Coordinates


