
Compare S.M. Gold with Similar Stocks
Stock DNA
Gems, Jewellery And Watches
INR 17 Cr (Micro Cap)
10.00
45
0.00%
0.41
4.49%
0.46
Total Returns (Price + Dividend) 
S.M. Gold for the last several years.
Risk Adjusted Returns v/s
Returns Beta

News
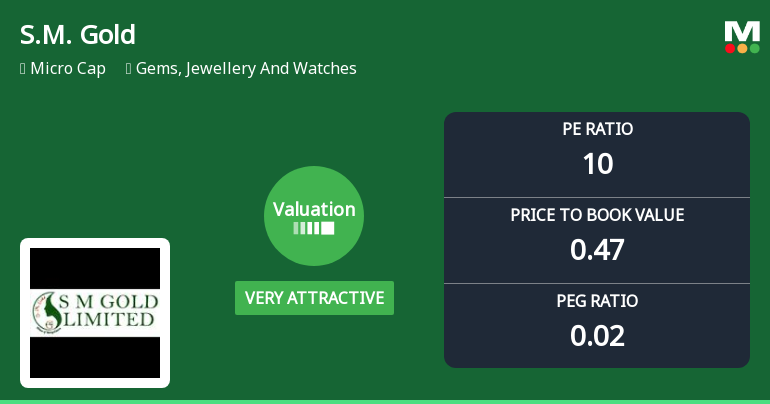
S.M. Gold Ltd Valuation Shifts to Very Attractive Amidst Challenging Market Returns
S.M. Gold Ltd, a micro-cap player in the Gems, Jewellery and Watches sector, has witnessed a notable shift in its valuation parameters, moving from an attractive to a very attractive rating. Despite ongoing market headwinds and a recent downgrade in its overall Mojo Grade to Sell, the company’s price-to-earnings (P/E) and price-to-book value (P/BV) ratios now present compelling value compared to both historical levels and peer averages.
Read full news article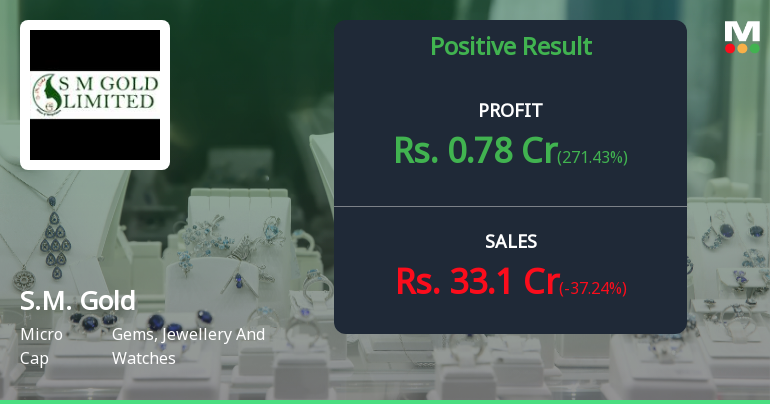
S.M. Gold Q4 FY26: Strong Revenue Surge Masks Persistent Profitability Challenges
S.M. Gold Ltd., an Ahmedabad-based gems and jewellery company, reported sharply improved quarterly revenues in Q4 FY26, though the micro-cap firm continues to grapple with wafer-thin margins and weak return ratios that have plagued its financial performance for years. With a market capitalisation of just ₹16.00 crores and the stock trading at ₹12.20, the company faces mounting investor scepticism despite a 125.63% year-on-year revenue jump in the March quarter.
Read full news article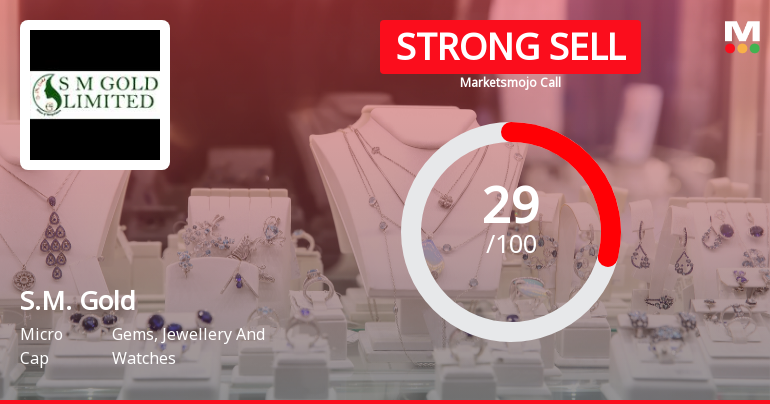
S.M. Gold Ltd Downgraded to Strong Sell Amid Weak Fundamentals and Bearish Technicals
S.M. Gold Ltd, a micro-cap player in the Gems, Jewellery and Watches sector, has been downgraded from a Sell to a Strong Sell rating as of 26 May 2026. This revision reflects a deterioration in its technical outlook, persistent fundamental weaknesses, and valuation concerns despite some recent positive financial results. The company’s Mojo Score has declined to 29.0, signalling heightened caution for investors amid ongoing underperformance relative to benchmarks.
Read full news article Announcements
Compliances-Reg.24(A)-Annual Secretarial Compliance
29-May-2026 | Source : BSEAnnual Secretarial Compliance Report for the Financial year ended on 31st March 2026.
Audited Financial Result For Quarter And Year Ending 31St March 2026 Along With Audit Report
29-May-2026 | Source : BSEAudited Financial Result for Quarter and year ending 31st March 2026 along with Audit Report
Board Meeting Outcome for Outcome Of Board Meeting Held On 29Th May 2026 And Submission Of Standalone Audited Financial Results For Quarter And Financial Year Ended 31St March 2026.
29-May-2026 | Source : BSEBoard of Directors of the Company in their meeting held today i.e. on Friday 29th May 2026 inter-alia considered and approve the following among other matters: 1. The Standalone Audited Financial results of the Company for the Quarter and financial year ended on 31st March 2026. 2. The Audit Report for the said period as submitted by M/s. Shah Karia & Associates Chartered Accountants Statutory Auditors of the Company was also considered and taken on record.
Corporate Actions

No Upcoming Board Meetings

No Dividend history available

No Splits history available

S.M. Gold Ltd has announced 1:2 bonus issue, ex-date: 08 Oct 20

No Rights history available
Quality key factors
Valuation key factors
Technicals key factors
 Technical Indicator Scale: Bearish, Mildly Bearish, Sideways, Mildly Bullish, Bullish Turned
 Shareholding Snapshot : Mar 2026
Shareholding Compare (%holding)
Non Institution
None
Held by 0 Schemes
Held by 0 FIIs
Priyank S Shah (31.6%)
Veeram Barter Private Limited (12.09%)
39.84%
Quarterly Results Snapshot (Standalone) - Mar'26 - QoQ

QoQ Growth in quarter ended Mar 2026 is -37.24% vs 18.01% in Dec 2025

QoQ Growth in quarter ended Mar 2026 is 271.43% vs -51.16% in Dec 2025
Half Yearly Results Snapshot (Standalone) - Sep'25
Growth in half year ended Sep 2025 is 68.76% vs 49.09% in Sep 2024
Growth in half year ended Sep 2025 is 75.76% vs -54.79% in Sep 2024
Nine Monthly Results Snapshot (Standalone) - Dec'25
YoY Growth in nine months ended Dec 2025 is 68.14% vs 33.25% in Dec 2024
YoY Growth in nine months ended Dec 2025 is 68.09% vs -69.08% in Dec 2024
Annual Results Snapshot (Standalone) - Mar'26
YoY Growth in year ended Mar 2026 is 77.77% vs 41.03% in Mar 2025
YoY Growth in year ended Mar 2026 is 175.44% vs -52.10% in Mar 2025
About S.M. Gold Ltd

Company Coordinates


