
Compare Shankar Lal Ram. with Similar Stocks
Dashboard
High Management Efficiency with a high ROCE of 31.07%
Company has a Debt to Equity ratio (avg) of 0.07 times
Poor long term growth as Operating profit has grown by an annual rate 9.95% of over the last 5 years
With ROCE of 13.4, it has a Attractive valuation with a 2.1 Enterprise value to Capital Employed
Majority shareholders : Promoters
Consistent Underperformance against the benchmark over the last 3 years
Total Returns (Price + Dividend) 
Latest dividend: 0 per share ex-dividend date: Sep-19-2025
Risk Adjusted Returns v/s
Returns Beta

News

Shankar Lal Rampal Dye-Chem Ltd is Rated Hold
Shankar Lal Rampal Dye-Chem Ltd is rated 'Hold' by MarketsMOJO, with this rating last updated on 30 May 2026. However, the analysis and financial metrics discussed here reflect the company’s current position as of 11 June 2026, providing investors with an up-to-date view of the stock’s fundamentals, valuation, financial trends, and technical outlook.
Read full news article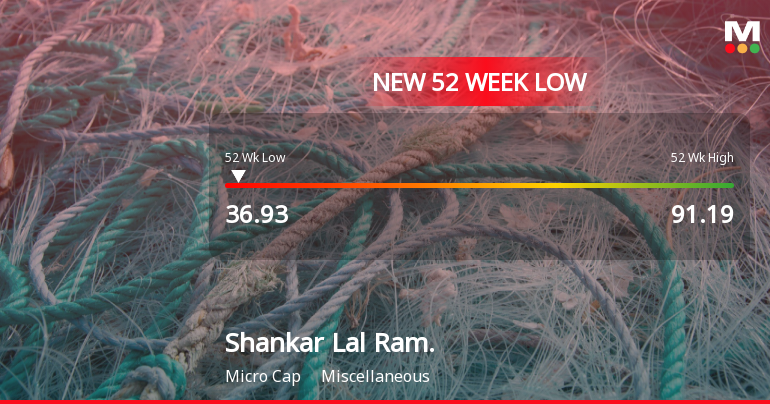
Are Shankar Lal Rampal Dye-Chem Ltd latest results good or bad?
Shankar Lal Rampal Dye-Chem Ltd reported its Q4 FY26 results, showcasing significant sequential improvements across key financial metrics. The company achieved a net profit of ₹4.80 crores, reflecting a substantial quarter-on-quarter growth of 130.77% from ₹2.08 crores in Q3 FY26. Additionally, net sales surged to ₹139.30 crores, marking a 53.85% increase from ₹90.54 crores in the previous quarter. This performance represents the highest quarterly revenue and profit in the company's history, indicating a strong finish to FY26. The operating profit, excluding other income, also saw a remarkable increase, rising to ₹6.76 crores from ₹2.67 crores, which translates to a 153.18% sequential growth. The operating margin improved to 4.85%, up from 2.95% in the prior quarter, suggesting enhanced operational efficiency and better cost absorption. Despite these positive quarterly results, it is important to contextu...
Read full news article Announcements
Announcement under Regulation 30 (LODR)-Newspaper Publication
30-May-2026 | Source : BSEregulation 47 and 30 of sebi lodr regulation 2015-Financial Result March 2026 newspaper publication
RESULTS-FINANCIAL YEAR ENDIN 31/03/2026
29-May-2026 | Source : BSEPLEASE FINAD ATTACHED FINANCIALS AND ALLIED ANNEXURE FOR 31 MARCH 2026
Board Meeting Outcome for OUTCOME OF BOARD MEETING 29 MAY 2026
29-May-2026 | Source : BSEBOARD MEETING OUTCOME RELATED TO FINANCIAL RESULTS OF PERIOD ENDING 31/03/2026 ALONG WITH APPROVAL OF AGENDA STATED IN PRIOR INTIMATION DATED 21 MAY 2026
Corporate Actions

No Upcoming Board Meetings


No Splits history available

Shankar Lal Rampal Dye-Chem Ltd has announced 2:1 bonus issue, ex-date: 14 Jul 22

No Rights history available
Quality key factors
Valuation key factors
Technicals key factors
 Technical Indicator Scale: Bearish, Mildly Bearish, Sideways, Mildly Bullish, Bullish Turned
 Shareholding Snapshot : Mar 2026
Shareholding Compare (%holding)
Promoters
None
Held by 0 Schemes
Held by 1 FIIs (0.04%)
Oasis Capital Private Limited (10.84%)
Dwarka Prasad Bhadada (1.77%)
22.38%
Quarterly Results Snapshot (Standalone) - Mar'26 - QoQ

QoQ Growth in quarter ended Mar 2026 is 53.85% vs -19.66% in Dec 2025
QoQ Growth in quarter ended Mar 2026 is 130.77% vs -12.24% in Dec 2025
Half Yearly Results Snapshot (Standalone) - Sep'25

Growth in half year ended Sep 2025 is 21.66% vs 54.80% in Sep 2024
Growth in half year ended Sep 2025 is 9.82% vs 146.31% in Sep 2024
Nine Monthly Results Snapshot (Standalone) - Dec'25
YoY Growth in nine months ended Dec 2025 is 10.33% vs 40.04% in Dec 2024
YoY Growth in nine months ended Dec 2025 is -2.14% vs 84.02% in Dec 2024
Annual Results Snapshot (Standalone) - Mar'26
YoY Growth in year ended Mar 2026 is 15.69% vs 39.64% in Mar 2025
YoY Growth in year ended Mar 2026 is 18.44% vs 75.23% in Mar 2025
About Shankar Lal Rampal Dye-Chem Ltd

Company Coordinates


