
Compare Axita Cotton with Similar Stocks
Dashboard
Poor long term growth as Net Sales has grown by an annual rate of -17.96% and Operating profit at -54.94% over the last 5 years
With a fall in Net Sales of -31.73%, the company declared Very Negative results in Mar 26
With ROCE of -7.5, it has a Expensive valuation with a 3.9 Enterprise value to Capital Employed
Consistent Underperformance against the benchmark over the last 3 years
Stock DNA
Garments & Apparels
INR 293 Cr (Micro Cap)
NA (Loss Making)
25
0.00%
0.19
2.91%
4.44
Total Returns (Price + Dividend) 
Latest dividend: 0.06750000000000002 per share ex-dividend date: Aug-28-2024
Risk Adjusted Returns v/s
Returns Beta

News

Axita Cotton Ltd is Rated Strong Sell
Axita Cotton Ltd is rated Strong Sell by MarketsMOJO. This rating was last updated on 14 May 2026. However, all fundamentals, returns, and financial metrics discussed below reflect the stock’s current position as of 22 June 2026, providing investors with the latest comprehensive analysis.
Read full news article
Axita Cotton Ltd is Rated Strong Sell
Axita Cotton Ltd is rated Strong Sell by MarketsMOJO. This rating was last updated on 14 May 2026. However, all fundamentals, returns, and financial metrics discussed here reflect the stock’s current position as of 11 June 2026, providing investors with the latest comprehensive analysis.
Read full news article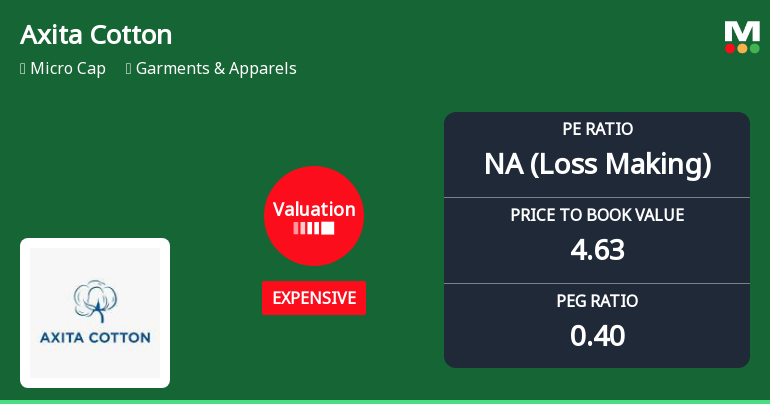
Axita Cotton Ltd Valuation Shifts Signal Heightened Price Risk Amid Sector Comparisons
Axita Cotton Ltd, a micro-cap player in the Garments & Apparels sector, has experienced a notable shift in its valuation parameters, moving from a very expensive to an expensive rating. This change, coupled with a recent downgrade in its Mojo Grade to Strong Sell, highlights growing investor caution amid deteriorating financial metrics and challenging market conditions.
Read full news article Announcements
Intimation Of Grant Of Stock Options Under The Axita Cotton Employee Stock Option Plan 2023 (ESOP 2023 Or Scheme) Of Axita Cotton Limited (The Company).
09-Jun-2026 | Source : BSEIntimation of grant of stock options under the Axita Cotton Employee Stock Option Plan 2023 of the Company.
Announcement under Regulation 30 (LODR)-Allotment of ESOP / ESPS
28-May-2026 | Source : BSEDisclosure of allotment of 178200 equity shares pursuant to the ESOP Scheme of the Company.
Format of the Initial Disclosure to be made by an entity identified as a Large Corporate : Annexure A
27-Apr-2026 | Source : BSEFormat of Initial Disclosure to be made by an entity identified as a Large Corporate.
| Sr. No. | Particulars | Details |
| 1 | Name of Company | Axita Cotton Ltd |
| 2 | CIN NO. | L17200GJ2013PLC076059 |
| 3 | Outstanding borrowing of company as on 31st March / 31st December as applicable (in Rs cr) | 0.00 |
| 4 | Highest Credit Rating during the previous FY | NA |
| 4a | Name of the Credit Rating Agency issuing the Credit Rating mentioned in (4) | Not Applicable |
| 5 | Name of Stock Exchange# in which the fine shall be paid in case of shortfall in the required borrowing under the framework | NSE |
Designation: Company Secretary and Compliance Officer
EmailId: cs@axita.in
Designation: Chief Financial Officer
EmailId: ca@axita.in
Date: 27/04/2026
Note: In terms para of 3.2(ii) of the circular beginning F.Y 2022 in the event of shortfall in the mandatory borrowing through debt securities a fine of 0.2% of the shortfall shall be levied by Stock Exchanges at the end of the two-year block period. Therefore an entity identified as LC shall provide in its initial disclosure for a financial year the name of Stock Exchange to which it would pay the fine in case of shortfall in the mandatory borrowing through debt markets.
Corporate Actions

No Upcoming Board Meetings

Axita Cotton Ltd has declared 10% dividend, ex-date: 28 Aug 24

Axita Cotton Ltd has announced 1:10 stock split, ex-date: 21 Oct 22

Axita Cotton Ltd has announced 1:10 bonus issue, ex-date: 13 Feb 26

No Rights history available
Quality key factors
Valuation key factors
Technicals key factors
 Technical Indicator Scale: Bearish, Mildly Bearish, Sideways, Mildly Bullish, Bullish Turned
 Shareholding Snapshot : Mar 2026
Shareholding Compare (%holding)
Non Institution
None
Held by 0 Schemes
Held by 10 FIIs (5.62%)
Nitinbhai Govindbhai Patel (26.51%)
M7 Global Fund Pcc - Nolana (1.66%)
46.46%
Quarterly Results Snapshot (Standalone) - Mar'26 - QoQ

QoQ Growth in quarter ended Mar 2026 is -31.73% vs 41.30% in Dec 2025
QoQ Growth in quarter ended Mar 2026 is -190.00% vs 6,400.00% in Dec 2025
Half Yearly Results Snapshot (Standalone) - Sep'25

Growth in half year ended Sep 2025 is -22.77% vs -53.81% in Sep 2024
Growth in half year ended Sep 2025 is -60.43% vs -65.96% in Sep 2024
Nine Monthly Results Snapshot (Standalone) - Dec'25
YoY Growth in nine months ended Dec 2025 is -39.68% vs -41.85% in Dec 2024
YoY Growth in nine months ended Dec 2025 is 44.07% vs -80.82% in Dec 2024
Annual Results Snapshot (Standalone) - Mar'26
YoY Growth in year ended Mar 2026 is -43.25% vs -40.80% in Mar 2025
YoY Growth in year ended Mar 2026 is 74.31% vs -94.64% in Mar 2025
About Axita Cotton Ltd

Company Coordinates


