
Compare Arvind Fashions with Similar Stocks
Dashboard
Healthy long term growth as Operating profit has grown by an annual rate 26.79%
The company has declared Positive results for the last 3 consecutive quarters
With ROCE of 18.7, it has a Very Attractive valuation with a 3.5 Enterprise value to Capital Employed
High Institutional Holdings at 36.61%
Stock DNA
Garments & Apparels
INR 6,316 Cr (Small Cap)
46.00
77
0.33%
1.35
14.68%
6.78
Total Returns (Price + Dividend) 
Latest dividend: 1.6073574014284318 per share ex-dividend date: Aug-12-2025
Risk Adjusted Returns v/s
Returns Beta

News
Arvind Fashions Ltd is Rated Hold by MarketsMOJO
Arvind Fashions Ltd is rated 'Hold' by MarketsMOJO, with this rating last updated on 06 April 2026. However, the analysis and financial metrics discussed here reflect the company’s current position as of 23 June 2026, providing investors with an up-to-date perspective on the stock’s fundamentals, valuation, financial trends, and technical outlook.
Read full news article
Arvind Fashions Ltd Technical Momentum Shifts Amid Mixed Indicator Signals
Arvind Fashions Ltd, a small-cap player in the Garments & Apparels sector, has experienced a notable shift in its technical momentum, reflecting a complex interplay of bullish and bearish signals across multiple timeframes. Despite a recent downgrade in daily moving averages and a slight dip in price, the stock’s medium-term indicators suggest a cautiously optimistic outlook, prompting a reassessment of its Hold rating by MarketsMOJO.
Read full news article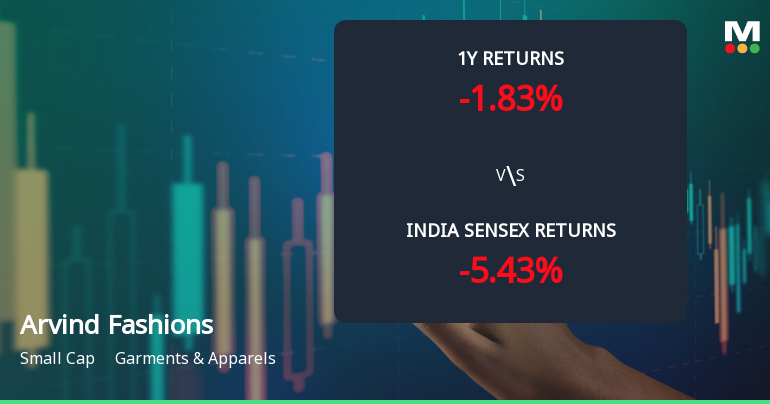
Arvind Fashions Ltd Technical Momentum Shifts Amid Mixed Indicator Signals
Arvind Fashions Ltd has experienced a notable shift in its technical parameters, moving from a mildly bearish trend to a sideways momentum. The stock’s recent price action, coupled with mixed signals from key technical indicators such as MACD, RSI, and moving averages, suggests a complex outlook for investors navigating the garments and apparels sector.
Read full news article Announcements
Announcement under Regulation 30 (LODR)-Newspaper Publication
13-Jun-2026 | Source : BSEArvind Fashions Limited has informed the Exchange about Copy of Newspaper Publication in respect of transfer of unclaimed sale proceeds of fractional shares to Investor Education and Protection Fund.
Communication To The Shareholders Holding Shares In Physical Mode To Update Their KYC Details
04-Jun-2026 | Source : BSEWe are attaching herewith an intimation being sent to the shareholders of the Company holding shares in physical mode regarding updation of their KYC details
Announcement under Regulation 30 (LODR)-Change in Management
25-May-2026 | Source : BSEArvind Fashions Limited has informed the Exchange regarding Appointment of Ms. Lakshmi Krishnan as Chief Human Resource Officer of the company.
Corporate Actions

No Upcoming Board Meetings

Arvind Fashions Ltd has declared 40% dividend, ex-date: 12 Aug 25

No Splits history available

No Bonus history available

Arvind Fashions Ltd has announced 3:20 rights issue, ex-date: 23 Feb 21
Quality key factors
Valuation key factors
Technicals key factors
 Technical Indicator Scale: Bearish, Mildly Bearish, Sideways, Mildly Bullish, Bullish Turned
 Shareholding Snapshot : Mar 2026
Shareholding Compare (%holding)
Promoters
8.3144
Held by 53 Schemes (18.9%)
Held by 151 FIIs (11.97%)
Aura Securities Private Limited (31.14%)
Mirae Asset Various Mutual Funds (4.36%)
21.73%
Quarterly Results Snapshot (Consolidated) - Mar'26 - QoQ

QoQ Growth in quarter ended Mar 2026 is -0.86% vs -2.89% in Dec 2025
QoQ Growth in quarter ended Mar 2026 is 83.69% vs -31.74% in Dec 2025
Half Yearly Results Snapshot (Consolidated) - Sep'25
Growth in half year ended Sep 2025 is 13.32% vs 0.18% in Sep 2024

Growth in half year ended Sep 2025 is 61.80% vs 491.20% in Sep 2024
Nine Monthly Results Snapshot (Consolidated) - Dec'25
YoY Growth in nine months ended Dec 2025 is 13.72% vs 2.44% in Dec 2024
YoY Growth in nine months ended Dec 2025 is 31.30% vs 2.26% in Dec 2024
Annual Results Snapshot (Consolidated) - Mar'26
YoY Growth in year ended Mar 2026 is 13.99% vs 8.47% in Mar 2025
YoY Growth in year ended Mar 2026 is 444.59% vs -144.11% in Mar 2025
About Arvind Fashions Ltd

Company Coordinates


