
Compare Vikas Lifecare with Similar Stocks
Dashboard
With a Operating Losses, the company has a Weak Long Term Fundamental Strength
- Company's ability to service its debt is weak with a poor EBIT to Interest (avg) ratio of -0.27
- The company has been able to generate a Return on Equity (avg) of 2.54% signifying low profitability per unit of shareholders funds
The company has declared Negative results for the last 3 consecutive quarters
Risky - Negative EBITDA
Underperformed the market in the last 1 year
Stock DNA
Trading & Distributors
INR 269 Cr (Micro Cap)
NA (Loss Making)
14
0.00%
0.16
-0.66%
0.49
Total Returns (Price + Dividend) 
Vikas Lifecare for the last several years.
Risk Adjusted Returns v/s
Returns Beta

News

Vikas Lifecare Ltd is Rated Strong Sell
Vikas Lifecare Ltd is rated Strong Sell by MarketsMOJO, with this rating last updated on 22 July 2024. However, the analysis and financial metrics discussed here reflect the stock’s current position as of 11 June 2026, providing investors with an up-to-date view of the company’s fundamentals, returns, and market standing.
Read full news article
Vikas Lifecare Ltd is Rated Strong Sell
Vikas Lifecare Ltd is rated Strong Sell by MarketsMOJO, with this rating last updated on 22 Jul 2024. However, the analysis and financial metrics discussed here reflect the company’s current position as of 29 May 2026, providing investors with the latest insights into its performance and outlook.
Read full news article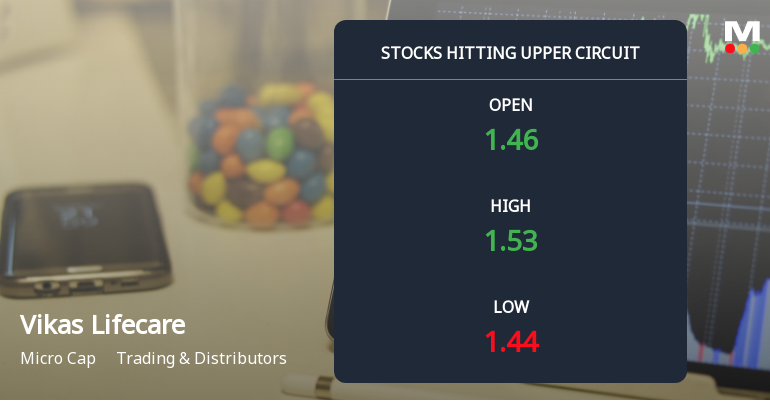
Vikas Lifecare Ltd Locks at Upper Circuit With 3.45% Gain — Buyers Queue, Sellers Absent
At Rs 1.52, the buying was done — not because demand dried up, but because the exchange wouldn't let the stock go any higher. Vikas Lifecare Ltd locked at its upper circuit of 3.45% on 26 May 2026, with buyers queuing and no sellers willing to part with shares.
Read full news article Announcements
Compliances-Reg.24(A)-Annual Secretarial Compliance
28-May-2026 | Source : BSEAnnual Secretarial Compliance Report for the year ended March 312026 as per Regulation 24A of SEBI (Listing Obligation and Disclosure Requirements) Regulation 2015 (Listing Regulation)
Shareholder Meeting / Postal Ballot-Scrutinizers Report
19-May-2026 | Source : BSESub: Outcome of Postal Ballot and Disclosure of Voting Results as per the requirements of Regulation 44 (3) and other applicable Regulations of the SEBI (Listing Obligations and Disclosure Requirements) Regulations 2015 as amended along with Scrutinizer Report.
Shareholder Meeting / Postal Ballot-Scrutinizers Report
18-May-2026 | Source : BSEOutcome of Postal Ballot and Disclosure of Voting Results as per the requirements of Regulation 44 (3) and other applicable Regulations of the SEBI (Listing Obligations and Disclosure Requirements) Regulations 2015 as amended along with Scrutinizer Report
Corporate Actions

No Upcoming Board Meetings

No Dividend history available

No Splits history available

No Bonus history available

Vikas Lifecare Ltd has announced 4:21 rights issue, ex-date: 29 Oct 21
Quality key factors
Valuation key factors
Technicals key factors
 Technical Indicator Scale: Bearish, Mildly Bearish, Sideways, Mildly Bullish, Bullish Turned
 Shareholding Snapshot : Mar 2026
Shareholding Compare (%holding)
Non Institution
0.0258
Held by 0 Schemes
Held by 10 FIIs (0.26%)
Vikas Garg (13.1%)
Srestha Finvest Limited (1.97%)
79.34%
Quarterly Results Snapshot (Consolidated) - Dec'25 - QoQ

QoQ Growth in quarter ended Dec 2025 is -31.35% vs 52.99% in Sep 2025

QoQ Growth in quarter ended Dec 2025 is 75.44% vs -195.16% in Sep 2025
Half Yearly Results Snapshot (Consolidated) - Sep'25
Growth in half year ended Sep 2025 is 2.97% vs 5.60% in Sep 2024
Growth in half year ended Sep 2025 is 763.74% vs -104.71% in Sep 2024
Nine Monthly Results Snapshot (Consolidated) - Dec'25
YoY Growth in nine months ended Dec 2025 is -4.08% vs 9.74% in Dec 2024
YoY Growth in nine months ended Dec 2025 is -200.13% vs -148.77% in Dec 2024
Annual Results Snapshot (Consolidated) - Mar'25
YoY Growth in year ended Mar 2025 is 7.69% vs -6.36% in Mar 2024
YoY Growth in year ended Mar 2025 is -175.62% vs 191.70% in Mar 2024
About Vikas Lifecare Ltd

Company Coordinates


