
Compare Wonder Electric. with Similar Stocks
Dashboard
Poor long term growth as Net Sales has grown by an annual rate of 13.23% and Operating profit at 13.85% over the last 5 years
Flat results in Mar 26
With ROCE of 11, it has a Expensive valuation with a 7.2 Enterprise value to Capital Employed
Despite the size of the company, domestic mutual funds hold only 0% of the company
Underperformed the market in the last 1 year
Stock DNA
Electronics & Appliances
INR 1,246 Cr (Small Cap)
139.00
58
0.21%
0.80
8.72%
12.03
Total Returns (Price + Dividend) 
Latest dividend: 0.09922562478000703 per share ex-dividend date: Feb-20-2026
Risk Adjusted Returns v/s
Returns Beta

News

Wonder Electricals Ltd is Rated Sell
Wonder Electricals Ltd is rated Sell by MarketsMOJO. This rating was last updated on 29 May 2026, reflecting a change from a previous 'Strong Sell' grade. However, all fundamentals, returns, and financial metrics discussed here are current as of 14 June 2026, providing investors with the latest assessment of the stock's position.
Read full news article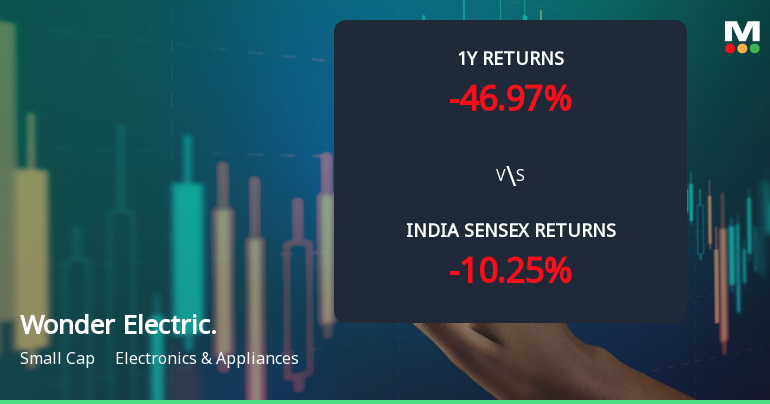
Wonder Electricals Ltd Sees Mixed Technical Signals Amid Price Momentum Shift
Wonder Electricals Ltd, a small-cap player in the Electronics & Appliances sector, has exhibited a nuanced shift in its technical momentum, reflecting a complex interplay of bullish and bearish indicators. Despite a modest daily price gain of 2.01%, the stock’s broader technical landscape reveals a cautious outlook, with key indicators signalling a transition from a strongly bearish stance to a mildly bearish trend.
Read full news article
Wonder Electricals Ltd is Rated Sell
Wonder Electricals Ltd is rated Sell by MarketsMOJO, with this rating last updated on 29 May 2026. However, the analysis and financial metrics discussed here reflect the stock's current position as of 03 June 2026, providing investors with an up-to-date view of the company’s fundamentals, returns, and market standing.
Read full news article Announcements
Announcement under Regulation 30 (LODR)-Newspaper Publication
29-May-2026 | Source : BSEAs per Attachment
Board Meeting Outcome for Outcome Of Board Meeting
28-May-2026 | Source : BSEFinancial Results
Financial Results
28-May-2026 | Source : BSEAs per attachment
Corporate Actions

No Upcoming Board Meetings

Wonder Electricals Ltd has declared 10% dividend, ex-date: 20 Feb 26

Wonder Electricals Ltd has announced 1:10 stock split, ex-date: 12 Nov 24

Wonder Electricals Ltd has announced 3:5 bonus issue, ex-date: 06 Oct 21

No Rights history available
Quality key factors
Valuation key factors
Technicals key factors
 Technical Indicator Scale: Bearish, Mildly Bearish, Sideways, Mildly Bullish, Bullish Turned
 Shareholding Snapshot : Mar 2026
Shareholding Compare (%holding)
Promoters
None
Held by 0 Schemes
Held by 8 FIIs (9.97%)
Jatin Anand (12.18%)
Bhaijee Broking & Investments Private Limited (8.65%)
7.79%
Quarterly Results Snapshot (Standalone) - Mar'26 - QoQ

QoQ Growth in quarter ended Mar 2026 is 65.33% vs 60.20% in Dec 2025
QoQ Growth in quarter ended Mar 2026 is 1,159.65% vs 119.23% in Dec 2025
Half Yearly Results Snapshot (Standalone) - Sep'25

Growth in half year ended Sep 2025 is -30.74% vs 101.05% in Sep 2024
Growth in half year ended Sep 2025 is -40.87% vs 265.08% in Sep 2024
Nine Monthly Results Snapshot (Standalone) - Dec'25
YoY Growth in nine months ended Dec 2025 is -30.89% vs 87.48% in Dec 2024
YoY Growth in nine months ended Dec 2025 is -73.88% vs 104.14% in Dec 2024
Annual Results Snapshot (Standalone) - Mar'26
YoY Growth in year ended Mar 2026 is -26.80% vs 56.93% in Mar 2025
YoY Growth in year ended Mar 2026 is -52.10% vs 87.20% in Mar 2025
About Wonder Electricals Ltd

Company Coordinates


