
Compare Alphalogic Tech. with Similar Stocks
Stock DNA
Computers - Software & Consulting
INR 285 Cr (Micro Cap)
57.00
20
0.00%
0.88
9.59%
5.47
Total Returns (Price + Dividend) 
Alphalogic Tech. for the last several years.
Risk Adjusted Returns v/s
Returns Beta

News

Alphalogic Techsys Ltd is Rated Sell
Alphalogic Techsys Ltd is rated 'Sell' by MarketsMOJO, with this rating last updated on 23 May 2026. While the rating was revised on that date, the analysis and financial metrics discussed here reflect the stock's current position as of 03 July 2026, providing investors with an up-to-date view of the company’s performance and outlook.
Read full news article
Alphalogic Techsys Ltd is Rated Sell
Alphalogic Techsys Ltd is rated 'Sell' by MarketsMOJO, with this rating last updated on 23 May 2026. However, the analysis and financial metrics discussed here reflect the stock's current position as of 22 June 2026, providing investors with the most recent and relevant data to assess the company’s outlook.
Read full news article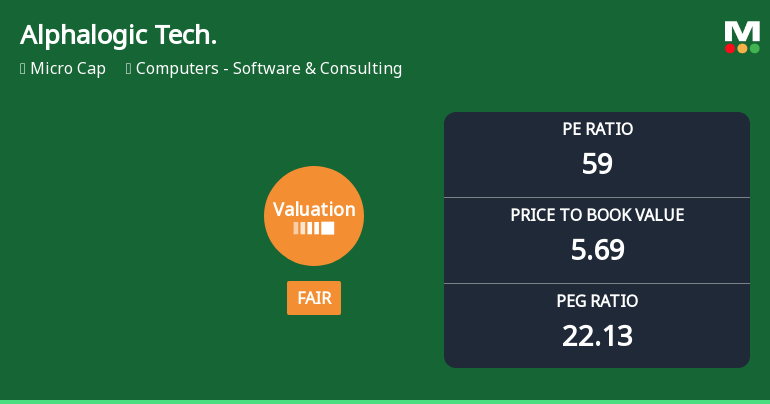
Alphalogic Techsys Ltd Valuation Shifts to Fair Amidst Market Volatility
Alphalogic Techsys Ltd, a micro-cap player in the Computers - Software & Consulting sector, has seen a notable shift in its valuation parameters, moving from an expensive to a fair valuation grade. Despite a challenging market environment and a significant decline in share price over the past year, the company’s price-to-earnings (P/E) and price-to-book value (P/BV) ratios suggest a more balanced price attractiveness relative to its historical and peer averages.
Read full news article Announcements
Closure of Trading Window
27-Jun-2026 | Source : BSEPursuant to Regulation 9 of SEBI (PIT) Regulations 2015 the trading window for dealing in securities of the company for all designated persons and their relatives shall remain closed for the quarter ended 30th june 2026 from 01.07.2026 until the expiry of 48 hours after the declaration of financial statements to the stock exchange.
Compliances-Reg.24(A)-Annual Secretarial Compliance
26-May-2026 | Source : BSEPursuant to Regulation 24A of SEBI (LODR) Regulations 2015 please find attached herewith Annual Secretarial Compliance Report for the financial year ended on March 31 2026.
Announcement under Regulation 30 (LODR)-Newspaper Publication
25-May-2026 | Source : BSEPursuant to Regulation 30 Regulation 47 and other applicable provisions of SEBI (LODR) Regulations 2015 we are enclosing herewith the copies of newspaper advertisement of audited Financial Results (Standalone and Consolidated) for the quarter and financial year ended March 31 2026.
Corporate Actions

No Upcoming Board Meetings

No Dividend history available

Alphalogic Techsys Ltd has announced 5:10 stock split, ex-date: 05 Oct 21

Alphalogic Techsys Ltd has announced 14:48 bonus issue, ex-date: 12 Jul 24

No Rights history available
Quality key factors
Valuation key factors
Technicals key factors
 Technical Indicator Scale: Bearish, Mildly Bearish, Sideways, Mildly Bullish, Bullish Turned
 Shareholding Snapshot : Mar 2026
Shareholding Compare (%holding)
Promoters
5.888
Held by 0 Schemes
Held by 0 FIIs
Anshu Goel (37.81%)
Abhishek Kumar Mahipal (2.35%)
25.6%
Quarterly Results Snapshot (Consolidated) - Mar'26 - QoQ

QoQ Growth in quarter ended Mar 2026 is 33.61% vs -43.15% in Dec 2025

QoQ Growth in quarter ended Mar 2026 is -25.55% vs -4.20% in Dec 2025
Half Yearly Results Snapshot (Consolidated) - Sep'25
Growth in half year ended Sep 2025 is -33.76% vs 94.48% in Sep 2024
Growth in half year ended Sep 2025 is 1.96% vs 27.50% in Sep 2024
Nine Monthly Results Snapshot (Consolidated) - Dec'25
YoY Growth in nine months ended Dec 2025 is -40.32% vs 75.01% in Dec 2024
YoY Growth in nine months ended Dec 2025 is 4.75% vs 19.56% in Dec 2024
Annual Results Snapshot (Consolidated) - Mar'26
YoY Growth in year ended Mar 2026 is -35.16% vs 44.58% in Mar 2025
YoY Growth in year ended Mar 2026 is 2.67% vs 17.39% in Mar 2025
About Alphalogic Techsys Ltd

Company Coordinates


