
Compare Easun Capital Ma with Similar Stocks
Stock DNA
Non Banking Financial Company (NBFC)
INR 30 Cr (Micro Cap)
126.00
21
0.00%
0.00
1.07%
1.34
Total Returns (Price + Dividend) 
Easun Capital Ma for the last several years.
Risk Adjusted Returns v/s
Returns Beta

News

Easun Capital Markets Ltd is Rated Sell by MarketsMOJO
Easun Capital Markets Ltd is rated Sell by MarketsMOJO, with this rating last updated on 06 July 2026. While the rating change occurred on that date, the analysis and financial metrics presented here reflect the stock’s current position as of 09 July 2026, providing investors with the most up-to-date view of the company’s fundamentals, returns, and market standing.
Read full news article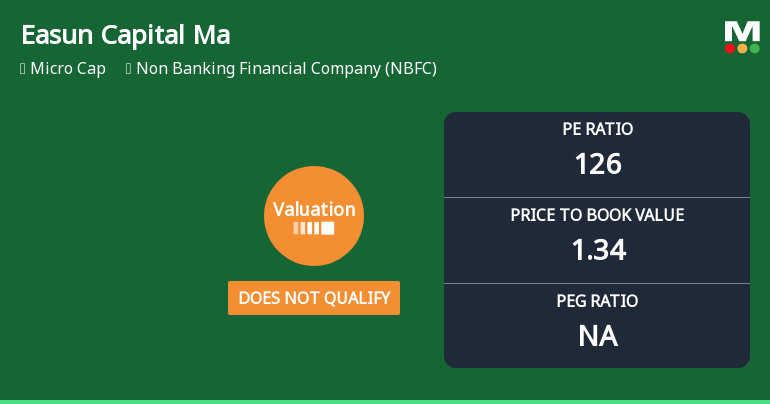
Easun Capital Markets Ltd: Valuation Shifts and Price Attractiveness Analysis
Easun Capital Markets Ltd has witnessed a notable shift in its valuation parameters, reflecting evolving investor perceptions amid a volatile NBFC sector. The company’s price-to-earnings (P/E) ratio now stands at a lofty 125.83, while its price-to-book value (P/BV) has settled at 1.34, signalling a complex interplay between growth expectations and underlying asset value. This article analyses these valuation changes in the context of historical trends, peer comparisons, and broader market movements to assess the stock’s price attractiveness.
Read full news article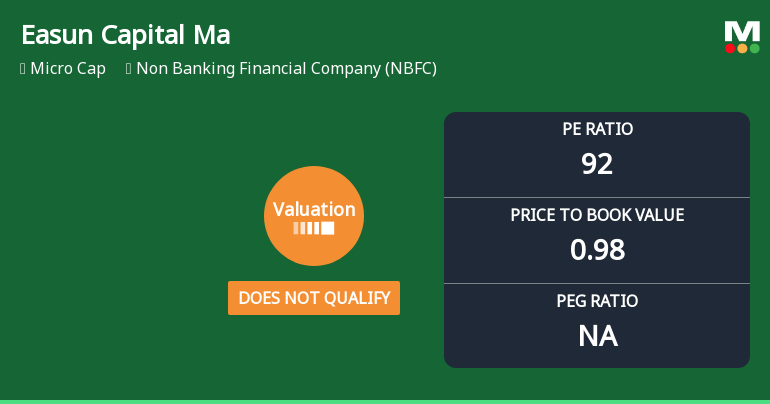
Easun Capital Markets Ltd Valuation Shifts Signal Changing Investor Sentiment
Easun Capital Markets Ltd, a micro-cap player in the Non Banking Financial Company (NBFC) sector, has undergone a significant change in its valuation parameters, prompting a downgrade to a Strong Sell rating. Despite a recent uptick in share price, the company’s elevated price-to-earnings (P/E) ratio and subdued return metrics raise concerns about its price attractiveness relative to peers and historical benchmarks.
Read full news article Announcements
Closure of Trading Window
29-Jun-2026 | Source : BSEAs per applicable regulations of SEBI (Prohibition of Insider Trading) Regulations 2015 Trading Window for trading in equity of the company shall remain closed for Designated Person and their immediate relatives having access to UPSI for the period from 01.07.2026 till 48 hours after the declaration of unaudited financial results of the company for the quarter ended 30.06.2026.
Announcement under Regulation 30 (LODR)-Newspaper Publication
01-Jun-2026 | Source : BSEThe extract of audited financial result for the quarter and year ended 31.03.2026 published in the following newspaper:- 1. Arthik Lipi (Regional Newspaper) Edition dated 31.05.2026 Sunday 2. the Echo Of India (English Newspaper) Edition dated 31.05.2026 Sunday.
Board Meeting Intimation for Audited Financial Result For Quarter And Year Ended 31.03.2026.
22-May-2026 | Source : BSEEasun Capital Markets Ltdhas informed BSE that the meeting of the Board of Directors of the Company is scheduled on 30/05/2026 inter alia to consider and approve Pursuant to Regulation 29(1) of the Securities and Exchange Board of India (Listing Obligations and Disclosure Requirements) Regulations 2015 we would like to inform you that a meeting of the Board of Directors of Easun Capital Markets Limited (the Company) is scheduled to be held at 5 Chittaranjan Avenue Kolkata-700072 on Saturday May 30 2026 at 1:30 P.M. IST inter alia to consider and approve the Audited Financial Results of the Company for the quarter and financial year ended March 31 2026 and any other item with the permission of the Chairperson.
Corporate Actions

No Upcoming Board Meetings

No Dividend history available

No Splits history available

No Bonus history available

No Rights history available
Quality key factors
Valuation key factors
Technicals key factors
 Technical Indicator Scale: Bearish, Mildly Bearish, Sideways, Mildly Bullish, Bullish Turned
 Shareholding Snapshot : Mar 2026
Shareholding Compare (%holding)
Non Institution
None
Held by 0 Schemes
Held by 0 FIIs
Apurva Salarpuria (40.33%)
Bluesky Infra Developers Private Limited (6.11%)
21.46%
Quarterly Results Snapshot (Standalone) - Mar'26 - QoQ

QoQ Growth in quarter ended Mar 2026 is 248.39% vs 29.17% in Dec 2025

QoQ Growth in quarter ended Mar 2026 is 5.56% vs 80.00% in Dec 2025
Half Yearly Results Snapshot (Standalone) - Sep'25
Growth in half year ended Sep 2025 is 17.31% vs -14.75% in Sep 2024
Growth in half year ended Sep 2025 is 69.77% vs -197.73% in Sep 2024
Nine Monthly Results Snapshot (Standalone) - Dec'25
YoY Growth in nine months ended Dec 2025 is 2.22% vs -1.10% in Dec 2024
YoY Growth in nine months ended Dec 2025 is 125.00% vs -131.25% in Dec 2024
Annual Results Snapshot (Standalone) - Mar'26
YoY Growth in year ended Mar 2026 is 63.11% vs 71.83% in Mar 2025
YoY Growth in year ended Mar 2026 is 0.00% vs -100.00% in Mar 2025
About Easun Capital Markets Ltd

Company Coordinates


