
Compare Assam Entrade with Similar Stocks
Dashboard
With a Operating Losses, the company has a Weak Long Term Fundamental Strength
- Poor long term growth as Operating profit has grown by an annual rate of 8.78%
- PAT(9M) At Rs 1.49 cr has Grown at -46.21%
- PBT LESS OI(Q) At Rs -0.34 cr has Fallen at -281.3% (vs previous 4Q average)
- EPS(Q) Lowest at Rs -6.32
With ROE of 2.9, it has a Very Expensive valuation with a 1.3 Price to Book Value
Underperformed the market in the last 1 year
Stock DNA
Non Banking Financial Company (NBFC)
INR 87 Cr (Micro Cap)
44.00
21
0.00%
0.03
2.93%
1.29
Total Returns (Price + Dividend) 
Assam Entrade for the last several years.
Risk Adjusted Returns v/s
Returns Beta

News

Assam Entrade Ltd is Rated Strong Sell
Assam Entrade Ltd is rated Strong Sell by MarketsMOJO, with this rating last updated on 01 June 2026. However, the analysis and financial metrics presented here reflect the stock's current position as of 28 June 2026, providing investors with the latest insights into the company’s performance and outlook.
Read full news article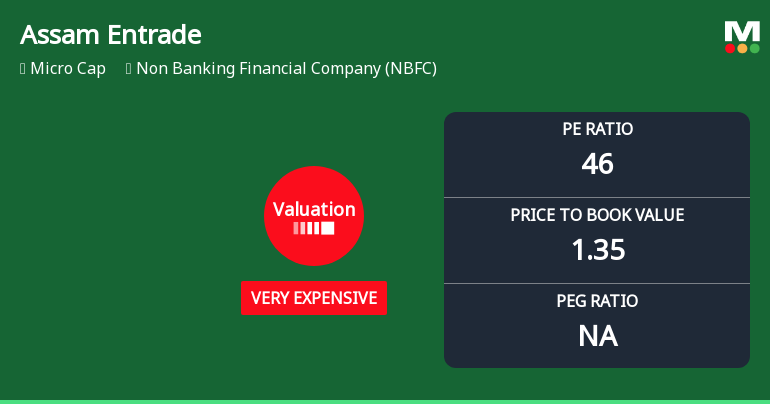
Assam Entrade Ltd Valuation Shifts to Very Expensive Amidst Weak Returns
Assam Entrade Ltd, a micro-cap player in the Non Banking Financial Company (NBFC) sector, has seen its valuation parameters shift markedly, raising concerns about price attractiveness. With its price-to-earnings (P/E) ratio surging to 46.12 and price-to-book value (P/BV) at 1.35, the stock now trades in the "very expensive" category, reflecting a significant premium over historical and peer averages. This article analyses the implications of these valuation changes amid the company’s recent financial performance and sector dynamics.
Read full news article
Assam Entrade Ltd is Rated Strong Sell
Assam Entrade Ltd is rated Strong Sell by MarketsMOJO, with this rating last updated on 01 June 2026. However, the analysis and financial metrics discussed here reflect the stock’s current position as of 16 June 2026, providing investors with an up-to-date view of the company’s fundamentals, valuation, financial trend, and technical outlook.
Read full news article Announcements
Closure of Trading Window
24-Jun-2026 | Source : BSEClosure of Trading Window
Disclosures under Reg. 29(2) of SEBI (SAST) Regulations 2011
19-Jun-2026 | Source : BSEThe Exchange has received the disclosure under Regulation 29(2) of SEBI (Substantial Acquisition of Shares & Takeovers) Regulations 2011 for Shivoy Gupta
Announcement under Regulation 30 (LODR)-Newspaper Publication
01-Jun-2026 | Source : BSENewspaper clippings of Audited Financial results for the quarter and year ended 31.03.2026
Corporate Actions

No Upcoming Board Meetings

No Dividend history available

No Splits history available

No Bonus history available

No Rights history available
Quality key factors
Valuation key factors
Technicals key factors
 Technical Indicator Scale: Bearish, Mildly Bearish, Sideways, Mildly Bullish, Bullish Turned
 Shareholding Snapshot : Dec 2025
Shareholding Compare (%holding)
Promoters
None
Held by 0 Schemes
Held by 0 FIIs
Dharam Portfolio Private Limited (9.28%)
Shiv Kumar Gupta (8.37%)
35.4%
Quarterly Results Snapshot (Consolidated) - Mar'26 - QoQ

QoQ Growth in quarter ended Mar 2026 is -10.78% vs 16.00% in Dec 2025
QoQ Growth in quarter ended Mar 2026 is -137.76% vs 24,200.00% in Dec 2025
Half Yearly Results Snapshot (Consolidated) - Sep'25
Growth in half year ended Sep 2025 is -14.01% vs 27.19% in Sep 2024
Growth in half year ended Sep 2025 is -76.00% vs 471.43% in Sep 2024
Nine Monthly Results Snapshot (Consolidated) - Dec'25
YoY Growth in nine months ended Dec 2025 is -9.31% vs 29.19% in Dec 2024

YoY Growth in nine months ended Dec 2025 is 114.07% vs 62.65% in Dec 2024
Annual Results Snapshot (Consolidated) - Mar'26
YoY Growth in year ended Mar 2026 is -6.32% vs 17.61% in Mar 2025
YoY Growth in year ended Mar 2026 is -34.77% vs 125.37% in Mar 2025
About Assam Entrade Ltd

Company Coordinates


