
Compare Octavius Plant. with Similar Stocks
Dashboard
Weak Long Term Fundamental Strength with a -1.78% CAGR growth in Operating Profits over the last 5 years
- Company's ability to service its debt is weak with a poor EBIT to Interest (avg) ratio of 1.76
- The company has been able to generate a Return on Equity (avg) of 9.74% signifying low profitability per unit of shareholders funds
Positive results in Mar 26
With ROCE of 5, it has a Attractive valuation with a 0.9 Enterprise value to Capital Employed
Majority shareholders : Non Institution
Underperformed the market in the last 1 year
Total Returns (Price + Dividend) 
Octavius Plant. for the last several years.
Risk Adjusted Returns v/s
Returns Beta

News
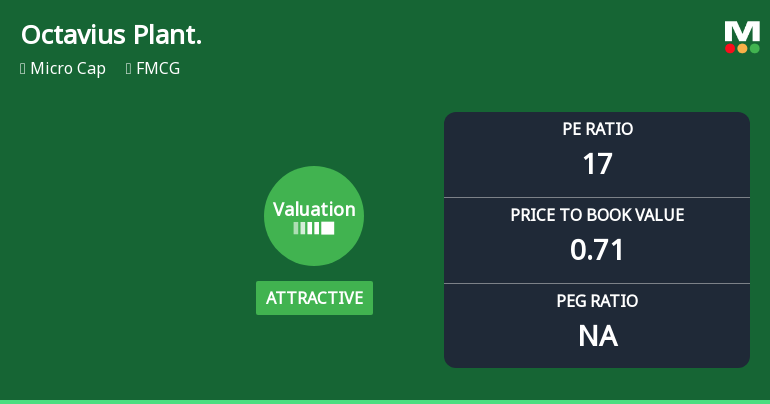
Octavius Plantations Ltd Valuation Shifts Signal Renewed Price Attractiveness
Octavius Plantations Ltd has witnessed a significant transformation in its valuation parameters, shifting from a previously risky profile to an attractive investment proposition. With a recent upgrade in its Mojo Grade from Sell to Hold, the micro-cap FMCG company is showing signs of improved price attractiveness, supported by favourable price-to-earnings and price-to-book value ratios relative to its historical averages and peer group.
Read full news article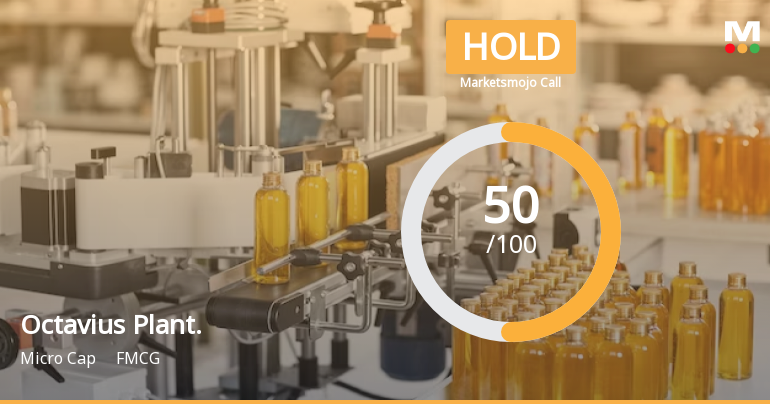
Octavius Plantations Ltd Upgraded to Hold on Technical Improvements and Valuation Appeal
Octavius Plantations Ltd has seen its investment rating upgraded from Sell to Hold, reflecting a notable improvement in technical indicators and valuation metrics despite ongoing challenges in its financial trend and quality parameters. The micro-cap FMCG company’s recent performance and market positioning have prompted analysts to reassess its outlook, balancing cautious optimism with recognition of persistent risks.
Read full news article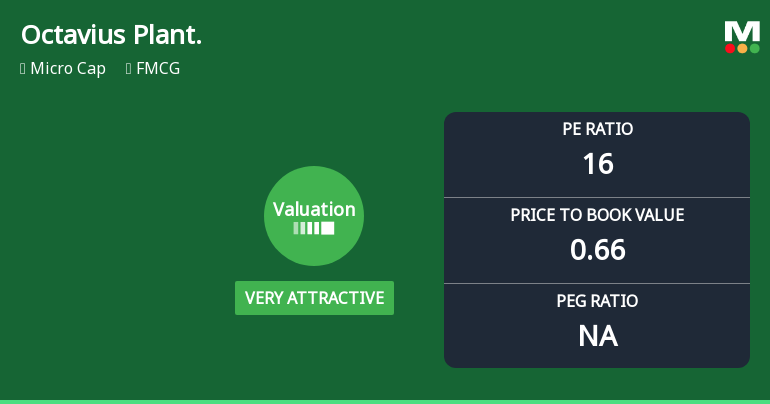
Octavius Plantations Ltd Valuation Shifts to Very Attractive Amid Market Challenges
Octavius Plantations Ltd has witnessed a notable shift in its valuation parameters, moving from an already attractive position to a very attractive one. This change, driven primarily by improvements in its price-to-earnings (P/E) and price-to-book value (P/BV) ratios, offers investors a fresh perspective on the stock’s price attractiveness amid a challenging market backdrop.
Read full news article Announcements
Results-Delay in Financial Results
17-Jul-2026 | Source : BSEFinancial Statement for Financial year ended 31/03/2026
Results-Delay in Financial Results
09-Jul-2026 | Source : BSEDear Sir/madam Company has already filed Audited Financial Statement for 4th/last Quarter and financial year ended 31/03/2026 on 28/05/2026 to the Exchange. Due to some Clarical error Statement on impact of Auditor Qualifications along with Audited financial statement was not filed on 28/05/2026. Audited Financial Statement alongwith Statement on impact of Auditor Qualifications for Financial Year ended 31/03/2026
Compliances-Reg.24(A)-Annual Secretarial Compliance
30-May-2026 | Source : BSENon Applicability of Reg 24(A)-Annual Secretarial Compliances
Corporate Actions

No Upcoming Board Meetings

No Dividend history available

No Splits history available

No Bonus history available

No Rights history available
Quality key factors
Valuation key factors
Technicals key factors
 Technical Indicator Scale: Bearish, Mildly Bearish, Sideways, Mildly Bullish, Bullish Turned
 Shareholding Snapshot : Mar 2026
Shareholding Compare (%holding)
Non Institution
None
Held by 0 Schemes
Held by 0 FIIs
Shalini Jain (33.8%)
Princi Jain (17.72%)
50.34%
Quarterly Results Snapshot (Standalone) - Mar'26 - QoQ

QoQ Growth in quarter ended Mar 2026 is 163.40% vs 141.33% in Dec 2025

QoQ Growth in quarter ended Mar 2026 is -44.83% vs 190.00% in Dec 2025
Half Yearly Results Snapshot (Standalone) - Sep'25
Growth in half year ended Sep 2025 is -38.41% vs 245.04% in Sep 2024
Growth in half year ended Sep 2025 is 11.43% vs -31.37% in Sep 2024
Nine Monthly Results Snapshot (Standalone) - Dec'25
YoY Growth in nine months ended Dec 2025 is 10.34% vs 79.33% in Dec 2024
YoY Growth in nine months ended Dec 2025 is 6.25% vs -43.86% in Dec 2024
Annual Results Snapshot (Standalone) - Mar'26
YoY Growth in year ended Mar 2026 is 127.03% vs 16.39% in Mar 2025
YoY Growth in year ended Mar 2026 is -3.45% vs -51.12% in Mar 2025
About Octavius Plantations Ltd

Company Coordinates


