
Compare Hitachi Energy with Similar Stocks
Dashboard
Company has a Debt to Equity ratio (avg) of 0.06 times
Healthy long term growth as Operating profit has grown by an annual rate 41.24%
With a growth in Net Sales of 32.27%, the company declared Very Positive results in Mar 26
Increasing Participation by Institutional Investors
Company is among the highest 1% of companies rated by MarketsMojo across all 4,000 stocks
Consistent Returns over the last 3 years
Stock DNA
Heavy Electrical Equipment
INR 154,622 Cr (Mid Cap)
156.00
47
0.02%
-0.89
19.87%
31.09
Total Returns (Price + Dividend) 
Latest dividend: 6 per share ex-dividend date: Aug-13-2025
Risk Adjusted Returns v/s
Returns Beta

News
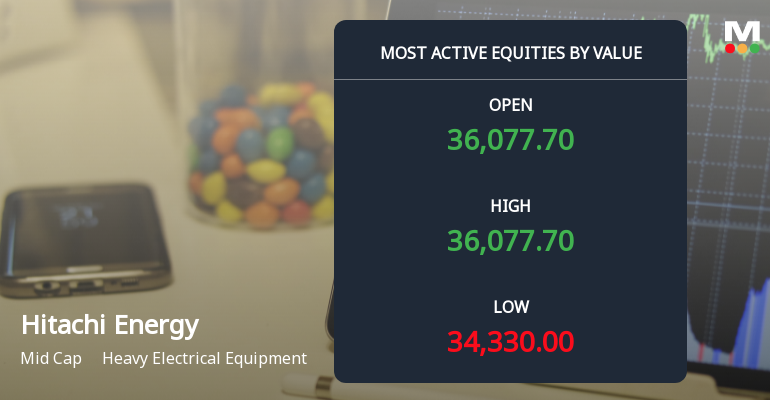
Hitachi Energy India Ltd Sees High-Value Trading Amid Recent Price Pressure
Hitachi Energy India Ltd (POWERINDIA), a mid-cap player in the heavy electrical equipment sector, has emerged as one of the most actively traded stocks by value on 24 June 2026. Despite a notable decline in its share price, the stock has attracted significant institutional interest and large order flows, signalling a complex market dynamic that warrants close attention from investors and analysts alike.
Read full news article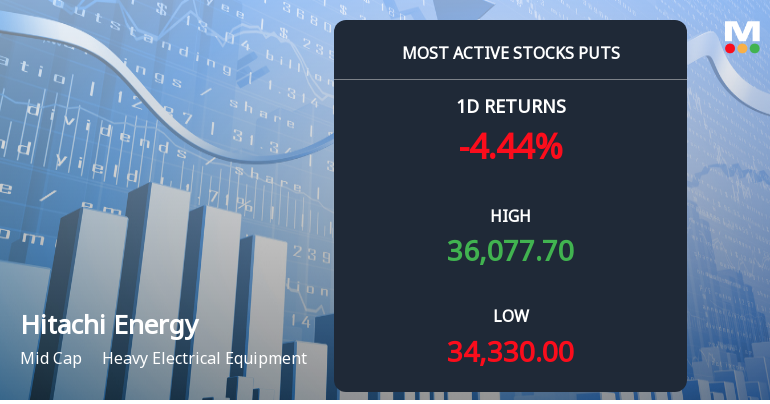
Rs 33,000 Puts — 4.3% Below Current Price — Draw 2,483 Contracts on Hitachi Energy India Ltd
Rs 33,000 strike put options on Hitachi Energy India Ltd attracted 2,483 contracts on 24 June 2026, signalling notable activity just days before the 30 June expiry. The stock closed at Rs 34,480, down 4.5% on the day, raising questions about whether this put activity reflects bearish positioning, hedging, or put writing.
Read full news article
Hitachi Energy India Ltd is Rated Buy
Hitachi Energy India Ltd is rated 'Buy' by MarketsMOJO, with this rating last updated on 18 Feb 2026. However, all fundamentals, returns, and financial metrics discussed here reflect the company’s current position as of 20 June 2026, providing investors with the latest insights into the stock’s performance and outlook.
Read full news article Announcements
Closure of Trading Window
15-Jun-2026 | Source : BSEPlease refer the enclosed file
Announcement under Regulation 30 (LODR)-Press Release / Media Release
12-Jun-2026 | Source : BSEPlease refer to the enclosed file.
Announcement under Regulation 30 (LODR)-Investor Presentation
08-Jun-2026 | Source : BSEPlease refer the enclosed file
Corporate Actions

No Upcoming Board Meetings

Hitachi Energy India Ltd has declared 400% dividend, ex-date: 21 Aug 26

No Splits history available

No Bonus history available

No Rights history available
Quality key factors
Valuation key factors
Technicals key factors
 Technical Indicator Scale: Bearish, Mildly Bearish, Sideways, Mildly Bullish, Bullish Turned
 Shareholding Snapshot : Mar 2026
Shareholding Compare (%holding)
Promoters
None
Held by 41 Schemes (4.33%)
Held by 681 FIIs (11.68%)
Hitachi Energy Ltd (71.31%)
None
8.25%
Quarterly Results Snapshot (Standalone) - Mar'26 - QoQ

QoQ Growth in quarter ended Mar 2026 is 33.94% vs 14.83% in Dec 2025
QoQ Growth in quarter ended Mar 2026 is 26.41% vs -1.11% in Dec 2025
Half Yearly Results Snapshot (Standalone) - Sep'25

Growth in half year ended Sep 2025 is 13.87% vs 27.53% in Sep 2024
Growth in half year ended Sep 2025 is 531.41% vs 130.98% in Sep 2024
Nine Monthly Results Snapshot (Standalone) - Dec'25
YoY Growth in nine months ended Dec 2025 is 18.87% vs 27.61% in Dec 2024
YoY Growth in nine months ended Dec 2025 is 228.54% vs 299.22% in Dec 2024
Annual Results Snapshot (Standalone) - Mar'26
YoY Growth in year ended Mar 2026 is 27.22% vs 22.14% in Mar 2025
YoY Growth in year ended Mar 2026 is 157.26% vs 134.45% in Mar 2025
About Hitachi Energy India Ltd

Company Coordinates


