
Compare Atam Valves with Similar Stocks
Stock DNA
Industrial Manufacturing
INR 79 Cr (Micro Cap)
32.00
37
0.00%
0.35
6.36%
2.05
Total Returns (Price + Dividend) 
Latest dividend: 0.7 per share ex-dividend date: Sep-23-2024
Risk Adjusted Returns v/s
Returns Beta

News

Atam Valves Ltd is Rated Strong Sell
Atam Valves Ltd is rated Strong Sell by MarketsMOJO, with this rating last updated on 29 December 2025. However, the analysis and financial metrics discussed here reflect the company’s current position as of 09 July 2026, providing investors with an up-to-date view of its performance and outlook.
Read full news article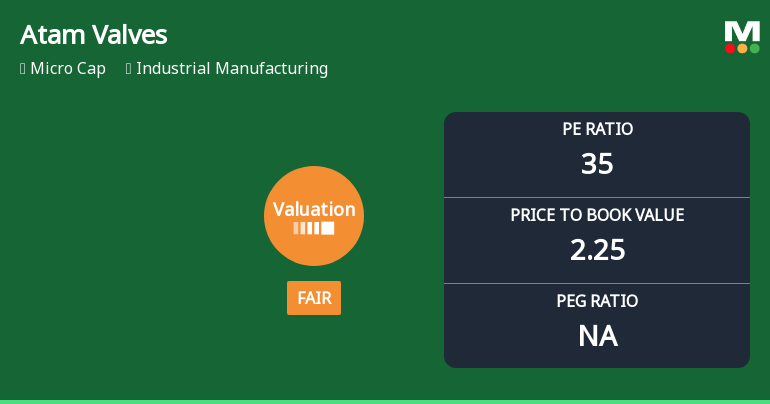
Atam Valves Ltd Valuation Shifts Signal Caution for Investors
Atam Valves Ltd, a micro-cap player in the industrial manufacturing sector, has experienced a notable shift in its valuation parameters, moving from an attractive to a fair rating. This change reflects evolving market perceptions amid a challenging performance backdrop and a competitive peer landscape. Investors are advised to carefully analyse the implications of the company’s current price-to-earnings and price-to-book ratios relative to historical averages and sector peers.
Read full news article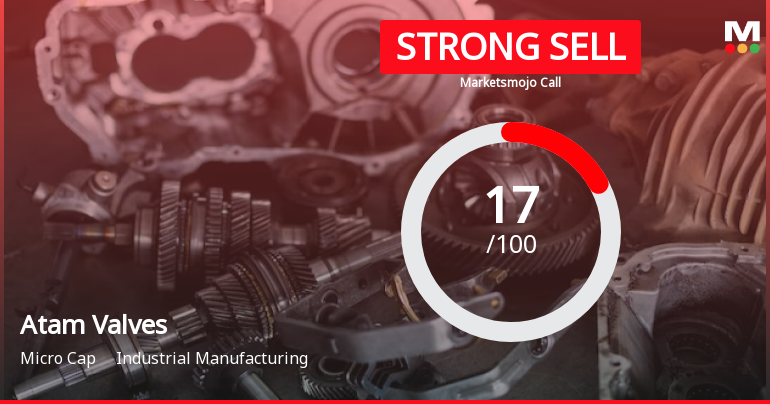
Atam Valves Ltd is Rated Strong Sell
Atam Valves Ltd is rated Strong Sell by MarketsMOJO, with this rating last updated on 29 December 2025. However, the analysis and financial metrics presented here reflect the stock's current position as of 28 June 2026, providing investors with an up-to-date view of the company’s performance and outlook.
Read full news article Announcements
Closure of Trading Window
24-Jun-2026 | Source : BSEINTIMATION OF CLOSURE OF TRADING WINDOW.
Announcement under Regulation 30 (LODR)-Newspaper Publication
27-May-2026 | Source : BSEPublication of Audited Financial Results for the Quarter and year ended March 31 2026
Statement On Deviation Or Variation Pursuant To Regulation 32 Of SEBI (LODR) Regulations 2015
26-May-2026 | Source : BSEStatement on Deviation or Variation
Corporate Actions

No Upcoming Board Meetings

Atam Valves Ltd has declared 7% dividend, ex-date: 23 Sep 24

No Splits history available

Atam Valves Ltd has announced 1:1 bonus issue, ex-date: 21 Oct 22

No Rights history available
Quality key factors
Valuation key factors
Technicals key factors
 Technical Indicator Scale: Bearish, Mildly Bearish, Sideways, Mildly Bullish, Bullish Turned
 Shareholding Snapshot : Mar 2026
Shareholding Compare (%holding)
Promoters
None
Held by 0 Schemes
Held by 1 FIIs (0.17%)
Amit Jain (35.59%)
Ritesh Jain (1.49%)
41.63%
Quarterly Results Snapshot (Standalone) - Mar'26 - QoQ

QoQ Growth in quarter ended Mar 2026 is 25.84% vs -8.76% in Dec 2025
QoQ Growth in quarter ended Mar 2026 is 248.28% vs -164.44% in Dec 2025
Half Yearly Results Snapshot (Standalone) - Sep'25

Growth in half year ended Sep 2025 is -16.30% vs 22.62% in Sep 2024
Growth in half year ended Sep 2025 is -17.37% vs 19.91% in Sep 2024
Nine Monthly Results Snapshot (Standalone) - Dec'25
YoY Growth in nine months ended Dec 2025 is -25.33% vs 29.50% in Dec 2024
YoY Growth in nine months ended Dec 2025 is -62.59% vs 32.38% in Dec 2024
Annual Results Snapshot (Standalone) - Mar'26
YoY Growth in year ended Mar 2026 is -21.83% vs 15.02% in Mar 2025
YoY Growth in year ended Mar 2026 is -61.59% vs 8.06% in Mar 2025
About Atam Valves Ltd

Company Coordinates


