
Compare Restaurant Brand with Similar Stocks
Dashboard
Weak Long Term Fundamental Strength with an average Return on Capital Employed (ROCE) of 0%
- Poor long term growth as Operating profit has grown by an annual rate 11.65% of over the last 5 years
- Low ability to service debt as the company has a high Debt to EBITDA ratio of 6.24 times
Flat results in Mar 26
Risky - Negative Operating Profits
Consistent Underperformance against the benchmark over the last 3 years
Stock DNA
Leisure Services
INR 4,618 Cr (Small Cap)
NA (Loss Making)
NA
0.00%
1.82
-23.00%
5.33
Total Returns (Price + Dividend) 
Restaurant Brand for the last several years.
Risk Adjusted Returns v/s
Returns Beta

News
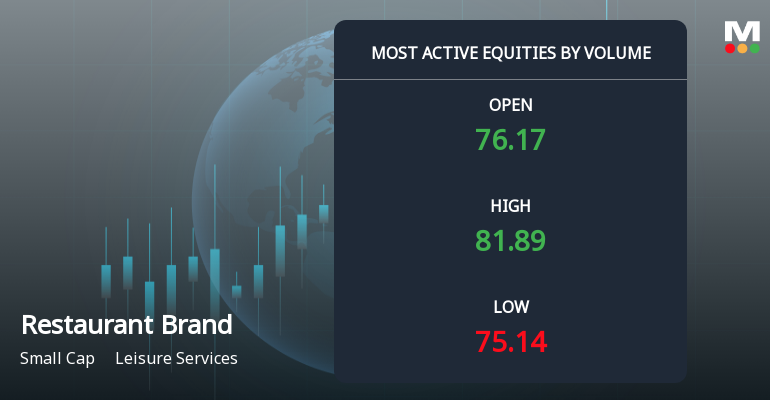
Restaurant Brands Asia Ltd Sees Exceptional Volume Surge Amid Strong Market Outperformance
Restaurant Brands Asia Ltd (RBA) has emerged as one of the most actively traded stocks in the Leisure Services sector on 22 June 2026, registering a remarkable volume surge alongside a robust price rally. The stock outperformed its sector and benchmark indices, signalling heightened investor interest and potential accumulation despite a recent downgrade in its Mojo Grade to Strong Sell.
Read full news article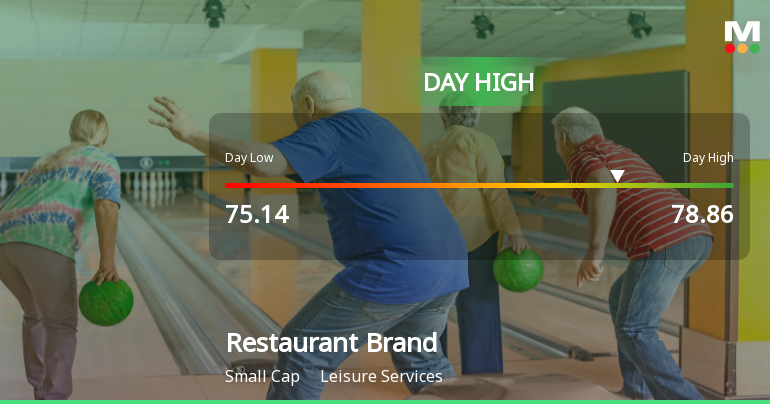
Restaurant Brands Asia Ltd Surges 7.25% to Day's High of Rs 78.32 — Outperforms Sector by 5.38 Percentage Points
The Sensex advanced 0.63% on 22 Jun 2026, yet Restaurant Brands Asia Ltd outpaced the broader market with a 7.25% gain, outperforming its Leisure Services sector by 5.38 percentage points. This sharp single-session surge rewrites the short-term narrative for the stock, which has been on a steady upward trajectory over the past week.
Read full news article
Restaurant Brands Asia Ltd is Rated Strong Sell
Restaurant Brands Asia Ltd is rated Strong Sell by MarketsMOJO, with this rating last updated on 15 June 2026. However, the analysis and financial metrics discussed here reflect the company’s current position as of 21 June 2026, providing investors with the latest insights into its performance and outlook.
Read full news article Announcements
Disclosures under Reg. 29(2) of SEBI (SAST) Regulations 2011
05-Jun-2026 | Source : BSEThe Exchange has received the disclosure under Regulation 29(2) of SEBI (Substantial Acquisition of Shares & Takeovers) Regulations 2011 for QSR Asia Pte Ltd & PACs
Revised Disclosures under Reg. 29(2) of SEBI (SAST) Regulations 2011
05-Jun-2026 | Source : BSEThe Exchange has received the revised disclosure under Regulation 29(2) of SEBI (Substantial Acquisition of Shares & Takeovers) Regulations 2011 for Rajasthan Global Securities Pvt Ltd
Disclosures under Reg. 29(2) of SEBI (SAST) Regulations 2011
05-Jun-2026 | Source : BSEThe Exchange has received the disclosure under Regulation 29(2) of SEBI (Substantial Acquisition of Shares & Takeovers) Regulations 2011 for Rajasthan Global Securities Pvt Ltd
Corporate Actions

No Upcoming Board Meetings

No Dividend history available

No Splits history available

No Bonus history available

No Rights history available
Quality key factors
Valuation key factors
Technicals key factors
 Technical Indicator Scale: Bearish, Mildly Bearish, Sideways, Mildly Bullish, Bullish Turned
 Shareholding Snapshot : Jun 2026
Shareholding Compare (%holding)
Non Institution
None
Held by 14 Schemes (23.63%)
Held by 50 FIIs (8.2%)
Qsr Asia Pte Ltd (9.22%)
Lenexis Foodworks Private Limited (18.07%)
16.62%
Quarterly Results Snapshot (Consolidated) - Mar'26 - QoQ

QoQ Growth in quarter ended Mar 2026 is -1.09% vs 1.60% in Dec 2025
QoQ Growth in quarter ended Mar 2026 is 1.22% vs 25.70% in Dec 2025
Half Yearly Results Snapshot (Consolidated) - Sep'25

Growth in half year ended Sep 2025 is 9.54% vs 3.51% in Sep 2024
Growth in half year ended Sep 2025 is 8.22% vs -13.50% in Sep 2024
Nine Monthly Results Snapshot (Consolidated) - Dec'25
YoY Growth in nine months ended Dec 2025 is 10.30% vs 4.25% in Dec 2024
YoY Growth in nine months ended Dec 2025 is 9.92% vs -20.54% in Dec 2024
Annual Results Snapshot (Consolidated) - Mar'26
YoY Growth in year ended Mar 2026 is 10.66% vs 4.66% in Mar 2025
YoY Growth in year ended Mar 2026 is 13.47% vs 0.80% in Mar 2025
About Restaurant Brands Asia Ltd

Company Coordinates


