
Compare Indigo Paints with Similar Stocks
Dashboard
The company is Net-Debt Free
Poor long term growth as Net Sales has grown by an annual rate of 9.39% and Operating profit at 9.79% over the last 5 years
Positive results in Mar 26
With ROE of 13, it has a Attractive valuation with a 4.2 Price to Book Value
High Institutional Holdings at 30.41%
Consistent Underperformance against the benchmark over the last 3 years
Total Returns (Price + Dividend) 
Latest dividend: 3.5 per share ex-dividend date: Aug-22-2025
Risk Adjusted Returns v/s
Returns Beta

News
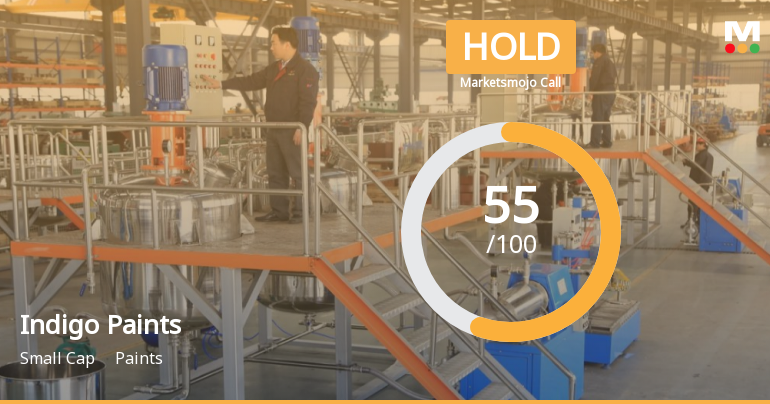
Indigo Paints Ltd is Rated Hold
Indigo Paints Ltd is rated 'Hold' by MarketsMOJO, with this rating last updated on 21 April 2026. However, the analysis and financial metrics discussed here reflect the stock's current position as of 29 June 2026, providing investors with the latest insights into the company’s performance and outlook.
Read full news article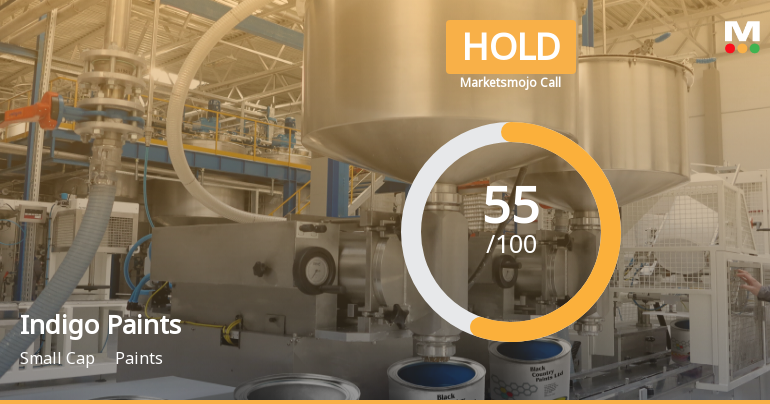
Indigo Paints Ltd is Rated Hold
Indigo Paints Ltd is rated 'Hold' by MarketsMOJO, with this rating last updated on 21 April 2026. However, the analysis and financial metrics discussed here reflect the stock's current position as of 18 June 2026, providing investors with the latest insights into the company’s performance and outlook.
Read full news article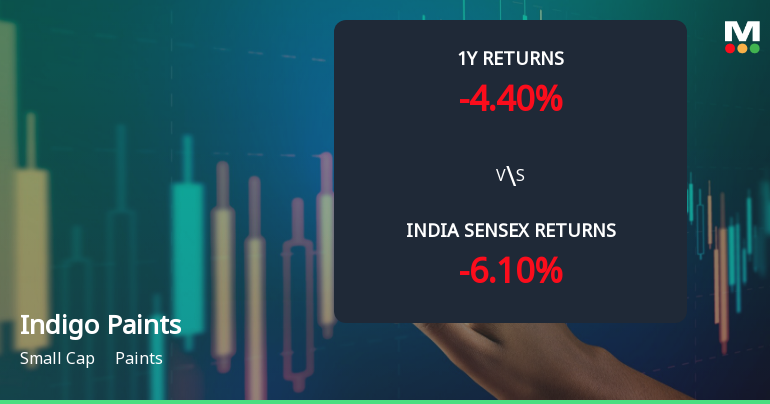
Indigo Paints Ltd Technical Momentum Shifts Amid Mixed Market Signals
Indigo Paints Ltd has exhibited a notable shift in its technical momentum, moving from a sideways trend to a mildly bearish stance, despite a recent 2.10% gain in daily price. The stock’s technical indicators present a complex picture, with weekly and monthly signals diverging, reflecting a nuanced outlook for investors in this small-cap paint sector player.
Read full news article Announcements
Compliances-Reg.24(A)-Annual Secretarial Compliance
30-May-2026 | Source : BSEPlease find enclosed the Annual Secretarial Compliance Report under Reg 24(A) of the SEBI (Listing Obligations and Disclosure Requirements) Regulations 2015 for the Financial Year ended March 31 2026.
Announcement under Regulation 30 (LODR)-Earnings Call Transcript
29-May-2026 | Source : BSEPlease find enclosed the transcript of the earnings conference call held with the analysts and investors on May 25 2026 to discuss the Financial Results of the Company for the quarter and year ended March 31 2026.
Announcement under Regulation 30 (LODR)-Analyst / Investor Meet - Outcome
25-May-2026 | Source : BSEWe wish to submit audio recording of Analyst / Investor Call held today i.e. on May 25 2026.
Corporate Actions

No Upcoming Board Meetings

Indigo Paints Ltd has declared 35% dividend, ex-date: 22 Aug 25

No Splits history available

No Bonus history available

No Rights history available
Quality key factors
Valuation key factors
Technicals key factors
 Technical Indicator Scale: Bearish, Mildly Bearish, Sideways, Mildly Bullish, Bullish Turned
 Shareholding Snapshot : Mar 2026
Shareholding Compare (%holding)
Promoters
None
Held by 12 Schemes (22.69%)
Held by 90 FIIs (7.41%)
Hemant Kamala Jalan (17.97%)
Nippon Life India Trustee Ltd-a/c Nippon India Small Cap Fund (8.65%)
13.76%
Quarterly Results Snapshot (Consolidated) - Mar'26 - QoQ

QoQ Growth in quarter ended Mar 2026 is 18.55% vs 14.97% in Dec 2025
QoQ Growth in quarter ended Mar 2026 is 58.52% vs 44.88% in Dec 2025
Half Yearly Results Snapshot (Consolidated) - Sep'25

Growth in half year ended Sep 2025 is 1.71% vs 7.59% in Sep 2024
Growth in half year ended Sep 2025 is 4.48% vs -13.37% in Sep 2024
Nine Monthly Results Snapshot (Consolidated) - Dec'25
YoY Growth in nine months ended Dec 2025 is 2.79% vs 3.46% in Dec 2024
YoY Growth in nine months ended Dec 2025 is 3.00% vs -9.38% in Dec 2024
Annual Results Snapshot (Consolidated) - Mar'26
YoY Growth in year ended Mar 2026 is 4.80% vs 2.65% in Mar 2025
YoY Growth in year ended Mar 2026 is 2.34% vs -3.77% in Mar 2025
About Indigo Paints Ltd

Company Coordinates


